

Classification of hydrothermally modified wood: use of FT-NIR spectroscopy and support vector machine classification Shailendra Kumar*
Wood Seasoning Discipline, Forest Products Division, Forest Research Institute, Dehradun, India
*Correspondence to: Shailendra Kumar
Citation: Kumar S (2025) Classification of hydrothermally modified wood: use of FT-NIR spectroscopy and support vector machine classification. Sci Academique 6(1): 32-40
Received: 01 February, 2025; Accepted: 26 February, 2025; Published: 8 March, 2025
Abstract
This study explores the effectiveness of support vector machine classification (SVMC) and FT-Near-infrared spectroscopy (NIRS) in accurately classifying thermally treated Melia dubia wood for improved quality control and processing efficiency. Hydrothermal pre-treatment of Melia dubia wood was conducted at steam temperatures of 125 °C, 150 °C, 175 °C, and 200°C for 25 minutes. FT-NIR spectra of the specimens were recorded, which were then split into calibration (70%) and testing (30%) sets. Classification models were developed using the nu-SVMC method with a radial basis function (RBF) kernel for both untransformed and standard normal variate (SNV)-transformed data. The untransformed data-based model achieved 88.89% training accuracy and 83.33% prediction accuracy, while the SNV-transformed based model improved to 91.66% and 86.11%, respectively. Misclassification rates were 11.11% for the untransformed data based model and 6.7% for the SNV-transformed data based model. Both models correctly classified all raw wood and 200°C-treated specimens. The study demonstrates that combining SVMC and NIRS enables rapid, non-destructive classification of thermally treated Melia dubia wood. It enhances quality control, optimizes treatment processes, and improves classification accuracy, especially with SNV transformation. The approach supports industrial automation, sustainability, and efficient resource use in wood processing.
Keywords: Near infrared spectroscopy (NIRS); Hydro-thermal treatment of wood; Support vector machine classification
Introduction
Accurately classifying thermally treated wood is essential for quality control tasks that guarantee constant quality throughout the production process. Nearly all of the attributes of the wood, including its mechanical, chemical, and aesthetic qualities, are altered by high-temperature thermal modification [1]. According to Schnabel et al. (2007) [2], different classes of thermally treated hardwood can also be defined using the color information. Near-infrared spectroscopy (NIRS) can be effective in classifying wood that has undergone heat modification [3]. Nasir et al. (2018) [4] investigated and assessed the thermo-wood classifier performance using Naïve Bayes (NB), support vector machines (SVM), and artificial neural networks (ANN). When it came to the classification of thermally modified wood, the SVM and NB models performed better and could be used for in-line quality monitoring.
Support vector machine classification (SVMC) performs better than alternative classification methods when the data collection is small and complex. The goal of a support vector machine, a supervised machine learning tool based on statistical methods, is to determine which hyperplane best divides the two classes. Popular applications of SVM are: weather prediction, power estimation, stock prediction, defect classification, speaker recognition, handwriting identification, image and audio processing, video analysis, and medical diagnosis [5]. SVMC was also used to classify Luwak and non-Luwak coffee samples using UV-Vis spectroscopy [6]. The soluble solids content (SSC) and pH of cola beverages were determined using visible and near infrared (VIS/NIR) transmission spectroscopy [7]; the target analyte (acetaminophen) mixed with excipients of different concentrations by weight [8]; and the magnesium oxide content in mineral medicine malcum [9] were also classified using SVMC.
Maximum separations between the two classes are guaranteed by the SVM hyperplane. Two forms of SVM exist: nonlinear and linear. When dealing with nonlinear SVM classification issues, kernel functions become crucial. There are four types of kernel functions that can be used to separate classes: sigmoid, polynomial, radial basis function (RBF), and linear. One of the crucial SVM parameters is gamma. The unintuitive parameter gamma defines the kernel function’s breadth or slope. The decision region widens as the “curve” of the decision border gets very low when the gamma value is low. The “curve” of the decision boundary grows when gamma is high, encompassing data points in decision boundary islands.
The nu-Support Vector Machine Classifier (ν-SVMC) is a variation of the standard Support Vector Machine (C-SVM) classifier. nu-SVMC is widely used in pattern recognition, image classification, bioinformatics, and spectroscopy-based classification. nu-SVMC (ν-Support Vector Machine Classification) is a variant of SVM that uses the parameter ν (0 < ν ≤ 1) to control the trade-off between model complexity and misclassification rate. It offers better control over the number of support vectors, leading to a more compact and generalizable model. Like standard SVM, it supports various kernel functions (e.g., RBF) for effective classification [10]. Compared to C-SVM, nu-SVMC provides a more intuitive way to balance accuracy and margin maximization, making it useful for applications like pattern recognition and spectroscopy-based classification.
This work intends to develop a quick and accurate classification approach for hydrothermally treated wood that does not require wet chemistry, which is critical in the thermal wood modification industry, where recognizing and supervising heat-treated hardwood specimens is essential. While thermal modification of wood is widely studied, there is limited research on the classification and quality assessment of Melia dubia using machine learning and spectroscopic techniques. The study findings are specific to Melia dubia; validating this approach for other commercially important wood species could improve its applicability. The main objective of this study is to demonstrate that the diffuse reflectance NIR spectroscopy along with support vector machine classification (SVMC) can be used to categorize commercial thermally treated wood.
Materials and Methods
Sample Preparation
Samples of Melia dubia wood were cut from recently felled trees, with dimensions of 50 mm in thickness, 50 mm in width, and 150 mm in length along the grain. The specimen’s faces were sanded with grit size 120 number sand paper to produce a consistent surface quality. The specimens were put in water for 24 h for saturation before hydro-thermal pre-treatment.
Hydro-thermal treatment of the wooden specimens
The specimens were pre-treated in a high-temperature autoclave at steam temperatures 125 oC, 150 oC, 175 oC and 200 oC for 25 minutes duration. Ten numbers of the specimens were used for each pre-treatment and the control. All the hydro-thermally treated specimens were dried along with control sspecimens until their moisture content fell between 10 and 12%.
Near infrared spectroscopy
The FT-NIR spectrophotometer (Brucker, MPA) was used to record the spectra of the test specimens. Its wavelength was between 4000 and 12820 cm-1, or 780 and 2400 nm. The device operates in the diffuse reflectance mode (detector: Pbs, resolution: 8 cm-1). Using a fiber optic module, the spectra of the treated and control specimens were taken from their tangential surfaces. By combining the NIR spectra from two evenly spaced spots on each tangential face, four spectra were obtained from each specimen. For every spectra collection, 32 scans were made; a single spectrum was created by averaging all the scans from the four spots from each specimen.
Data analysis
The Unscrambler® 10.2, a multivariate software from CAMO (Oslo, Norway), was used to analyse the data. Two SVMC classification models were developed using the FT-NIR data: model 1 (using untransformed data) and model 2 (using SNV transformed data). The absorbance value of the wave number spectrum for the training set specimens was pre-processed using Standard Normal Variate (SNV) transformation. The Unscrambler®’s support vector machine classification (SVMC) method is based on code created by National Taiwan University researchers Chih-Chung Chang and Chih-Jen Lin, which was made available under a modified BSD license. In The Unscrambler®, there are two SVMC types accessible. These are predicated on two distinct methods of reducing the classification error function: nu-SVMC and C-SVMC. The nu-SVMC algorithm was chosen for this study’s SVMC model development along with the Kernel Type Radial Basis Function (RBF). Grid search option was used to calculate gamma value (0.01), Nu value (0.5). Equal weights (1.00) were given to all the wave numbers.
The Standard Normal Variate (SNV) transformation
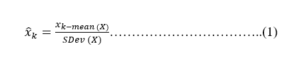
The SNV method normalizes the spectra by subtracting the mean of each spectrum and dividing by its standard deviation. As a result, after applying SNV, each spectrum will have a mean of 0 and a standard deviation of 1 (www.guifh.github.io). Each value xk of the data x is transformed according to the following equation:
SNV transformation is used to reduce the disparities in the global intensities of the signals as well as the multiplicative effects of particle size and dispersion.
Results and Discussion
Principal Component Analyses (PCA)
Figure 1A presents PCA of raw spectra (without any transformation) of the treatments and control. Two PCs (PC1 and PC2) explain 99% of the variance. The treatment temperature 200 oC appears to be distinctly separate from rest of the treatments. However, spectra of the raw wood and that of 125 oC share some common space. Similarly, 150 oC has common boundary with that of 125 oC and 175 oC. In Fig. 1B, presents PCA of the SNV transformed spectra. Here too, PC1 and PC2 explain 99% of the variances. However, the pattern of the distribution of the PCs is different as compared with that with fig.1A. There are similar common zones as were found in fig. 1A. In SVMC, the Kernel functions help to address such conditions where the datasets cannot be separated by a straight line (hyperplane). The pattern (Fig. 1B) indicates that linear kernel type may not be able to classify the groups accurately, rather, radial basis function (RBF) may be more suitable.
The SVM classification model
Using nu-SVMC algorithm, and kernel type RBF, classification models were developed for both the data sets: un-transformed and transformed. With the untransformed data, training accuracy of the developed model was 88.89%, whereas, the prediction accuracy was found to be 83.33%. Table 1 presents confusion matrix of the classification model, for which raw data was used to develop (no transformation). A confusion matrix is a performance evaluation tool for classification models, including Support Vector Machine Classifiers (SVMC). It provides a detailed breakdown of predictions by showing how many instances were classified correctly and incorrectly for each class. The confusion matrix of the model, as presented in the table, and Fig. 1A, 1 out of 7 specimens of treatment 125 oC, overlapped with 150 oC treatment temperature. For the specimens of treatment 150 oC, 1 out of 7 specimens overlapped with that of 175 oC. Thus, 2 out of 7 specimens from 150 oC treatment were not clearly classified, whereas, for 175 oC, one out of 7 specimens was not classified clearly. The specimens from the rest of the two treatments (200 oC and raw wood) were correctly classified without any overlapping. Thus, 100 % of the specimens from treatment temperature 200 oC and raw wood were clearly classified.
The SVMC model developed through SNV transformation had the training accuracy of 91.66%, whereas, the prediction accuracy was 86.11%. Thus, the SNV transformed SVM model had approximately 3% higher prediction accuracy as compared with that of the model from un-transformed spectra.
Table 2 presents the confusion matrix for the model from SNV transformed NIR spectra. As presented in the table, 1 out of 7 specimens from 125 oC was undiscernible with that of 150 oC treatment temperature. Treatment temperature 150 oC and 175 oC had 1 out of 7 specimens in common space with each other. Similar to the previous model, the raw and treatment temperature 200 oC were 100% discernible from rest of the treatments.
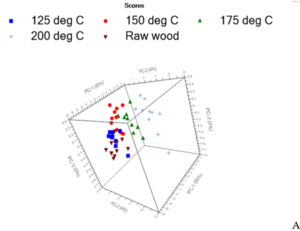
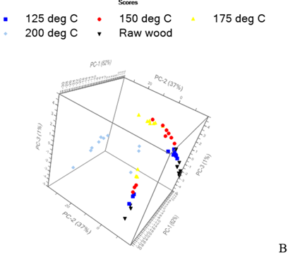
Figure 1: PC scores of raw NIR spectra (A) and SNV transformed nspectra (B).
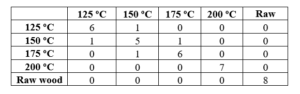 Table 1: Confusion matrix of the model from raw NIR spectra.
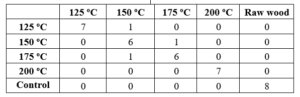
Table 2: Confusion matrix of the model from SNV transformed NIR spectra.
The confusion matrix of both the models show that model from SNV transformed spectra was relatively more accurate.
Validation results of the models
Table 3 presents the validations result of the models. Model 1 (using untransformed data) classified 11.11% of the specimens incorrectly. Out of the incorrectly classified specimens, 1 specimen of 125 oC was wrongly classified as that of 150 oC, whereas 1 number of specimen of 150 oC, was classified as 125 oC. Similarly, 1 specimen of 150 oC was wrongly classified as that of 175 oC, whereas 1number of specimen of 175 oC, was classified as 150 oC. All the specimens from 200 oC treatment and the raw specimens were correctly classified.
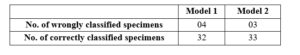
Table 3: Model validation results.
As presented in table, the model 2 resulted in 3 wrong classified specimens. Out of total, 1 number of specimen of 150 oC was classified as 125 oC. Rest of the two specimens wrongly classified were from 150 oC and 175 oC.
Classification of unknown test specimens using SVM classification model
Table 4 presents the results of the classification of unknown specimens using the developed SVMC models. Two out of the 15 specimens were classified wrong using model 1 resulting in success rate of 86.6 %. Contrary to the previous results, one of the specimen from 125 oC was classified as raw wood.
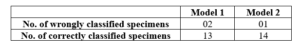
Table 4: Results of the classification of the unknown test specimens using SVMC models.
While using model 2 (data SNV transformed), 1 (175 oC) out of the 15 specimens was misclassified (150 oC) resulting in success rate of 93.3 %. Thus, the model 2 (SNV transformed data) has higher rate of the success in the classification of unknown specimen. However, both the models resulted in fairly good rate of the correct classification. Thus, NIRS in combination with SVMC proves to be a good option for screening and quality control in thermally modified wood production process.
SVMC combined with NIRS offers a strong balance of non-destructive analysis, rapid processing, and high classification accuracy, making it ideal for wood treatment assessments. While chemical and mechanical testing methods provide more detailed and direct property measurements, they come with higher costs and destructive nature. Other spectroscopic techniques, while useful for more in-depth molecular analysis, require more specialized equipment and data handling. Therefore, NIRS with SVMC stands out for its cost-effectiveness, non-destructive nature, and ability to handle complex spectral data in wood quality control and screening processes [11].
The study demonstrates the use of a machine learning tool (SVMC) and NIRS for the classification of modified wood. There are many further research gaps in this area which are required to be addressed in future. A comparative study using nu-SVMC with other classifiers such as Random Forest, Neural Networks, or Deep Learning models to identify the most effective approach for wood classification can further strengthen applicability of NIRS. Conducting the experiments with additional temperature levels and extended treatment durations may refine classification accuracy and help to understand the long-term effects on the wood properties. There is a need to validate the effectiveness of SVMC and NIRS on different wood species to assess the broader applicability of the method in the wood-processing industry. Finally, developing an automated real-time monitoring systems integrating NIRS and machine learning for industrial-scale thermal treatment of wood is needed.
Conclusion
The support vector machine classification (SVMC) model developed using untransformed data resulted in prediction accuracy of 83.33%, while its training accuracy was 88.89%. Whereas, the SNV-transformed SVMC model had a 91.66% training accuracy and an 86.11% prediction accuracy. When the models were tested on the unknown test samples, 11.11% of the specimens were incorrectly identified with the model from untransformed data; however, when the models using SNV transformation was tested, only 6.7% of the specimens were incorrectly classified. 100% of the specimens from both the raw and 200 °C-treated wood were categorized by both models. The study suggests that SVMC in combination with near infrared spectroscopy (NIRS) can be an effective tool in screening and quality control during the production of hydrothermally modified wood. Expanding experiments with varied temperatures, treatment durations, and different wood species can enhance accuracy and applicability. Developing automated real-time NIRS-based monitoring systems for industrial thermal treatment is crucial for practical implementation.
Acknowledgement
The author is thankful to Indian Council of Forestry Research and Education (ICFRE), Dehradun for funding support.
References
- Willems W, Lykidis C, Altgen M, Clauder L (2015) Quality control methods for thermally modiied wood. Holzforschung 69(7): 875–884.
- Schnabel T, Zimmer B, Petutschnigg AJ, Schonberger S (2007) An approach to classify thermally modified hardwoods by color. Forest Products Journal 57(9): 105.
- Bachle H, Zimmer B, Wegener G (2012) Classification of thermally modified wood by FT-NIR spectroscopy and SIMCA. Wood Sci Technol 46(6): 1181-1192.
- Nasir V, Nourian S, Avramidis S, Cool J (2019) Classification of thermally treated wood using machine learning techniques. Wood science and technology53: 275-288.
- Awad M, Khanna R (2015) Support vector machines for classification. Efficient learning machines: Theories, concepts, and applications for engineers and system designers: 39-66.
- Suhandy D, Yulia M (2018) Luwak coffee classification using UV-Vis spectroscopy data: comparison of linear discriminant analysis and support vector machine methods. Aceh International Journal of Science and Technology 7(2): 115-121.
- Liu F, He Y (2007) Use of visible and near infrared spectroscopy and least squares-support vector machine to determine soluble solids content and pH of cola beverage. Journal of agricultural and food chemistry 55(22): 8883-8888.
- O’Connell ML, Howley T, Ryder AG, Leger MN, Madden MG (2005) Classification of a target analyte in solid mixtures using principal component analysis, support vector machines, and Raman spectroscopy. In Opto-Ireland 2005: Optical Sensing and Spectroscopy (Vol. 5826, pp. 340-350). SPIE.
- Lei M, Chen L, Huang B, Chen K (2017) Determination of magnesium oxide content in mineral medicine talcum using near-infrared spectroscopy integrated with support vector machine. Applied Spectroscopy 71(11): 2427-2436.
- Schölkopf B, Smola AJ, Williamson RC, Bartlett PL (2000) New support vector algorithms. Neural computation 12(5): 1207-1245.
- Pasquini C (2003) Near infrared spectroscopy: fundamentals, practical aspects and analytical applications. Journal of the Brazilian Chemical Society 14(2): 198-219.