

Wood moisture content predictability of near Infrared Spectroscopy: Effect of specimen thickness and moisture content Shailendra Kumar*
Wood Seasoning Discipline, Forest Products Division, Forest Research Institute, Dehradun, India
*Correspondence to: Shailendra Kumar
Citation: Kumar S (2025) Wood moisture content predictability of near Infrared Spectroscopy: Effect of specimen thickness and moisture content. Sci Academique 6(1): 16-31
Received: 06 January, 2025; Accepted: 27 January, 2025; Published: 3 February, 2025
Abstract
Near Infrared Spectroscopy (NIRS) is an excellent tool being applied on organic materials for quality and process control. Sorting of kiln dried wood based on moisture content has always remained a tedious task during industrial production. The current study is centred on evaluation of suitability of NIRS for real time sorting of kiln dried wood with broad range of thicknesses and moisture content. A partial least square (PLS) regression model was developed including a broad range of moisture content and wood thicknesses. Coefficient of determination, Root mean square error of cross validation (RMSECV) and ratio of performance deviation (RPD) values of the calibration model were 0.966, 2.18 and 5.41 respectively. The results indicated that the NIR model could predict moisture content accurately only for moisture content below 25% for all the thickness ranges. It was found that the deviations in MC from actual values significantly depended upon the thicknesses of the wooden specimens used.
Keywords: Near Infrared Spectroscopy (NIRS); Non-Destructive Methodology; Moisture; Wood plantation; Melia dubia
Introduction
Near Infrared Spectroscopy (NIRS) is a useful tool being utilised in process monitoring and quality control in food and agriculture, pharmaceuticals and material science. Recent developments resulting in lower cost, miniature, portable NIRS equipment has drawn attention of researchers across academia and industries towards its utilisation for online quality and process control [1]. A review on the application of NIRS in agriculture and forestry and suggested that its applications for online or at-line quality monitoring are anticipated to follow future developments [2].
NIRS has been studied and utilised to predict number of wood properties like mechanical and chemical [3-4], differentiating juvenile and mature wood [5], wood identification [6] etc. The use of NIR spectral imaging techniques for batch testing of small quantities of samples and online grading was advocated [7].
NIRS is based on measurement of absorption of electromagnetic radiation with unique wavelength in the range of 750-2500 nm (13333 cm-1 to 4000 cm-1 wave numbers). The absorbed spectrum is unique and dependents upon various chemical and physical properties which can be correlated using statistical methods of prediction for the quality and process control. A predictive model should be accurate and robust for its utilisation in industrial operations [8]. Ratio of performance deviation (RPD) has been used frequently for assessing the predictive ability of a calibration model [9]. The ratio of reference value standard deviation (SD) to standard error of prediction (SEP) is known as the RPD. For a variety of end uses, RPD values are widely regarded as a reliable indicator. RPD value was categorised in range of 2.5-2.9 (recommended for screening purposes), whereas, higher RPD value (3.5-4) is categorised as ‘very good’ and is recommended for process control [10]. However, for normally distributed variable and large sample size, there is a certain relationship between RPD and R2 of the model and concluded that R2 and RPD are the same measures [10].
Various studies have been undertaken in the past on the development of calibration models for prediction of moisture content in wood [2,11]. The studies have shown that NIR spectroscopy is a useful tool for determining the moisture content of wood. In order to predict the moisture content of wood, Thygesen and Lundqvist (2000) [12] assessed the peak shifts along the NIR spectra of moist wood specimens generated by regulated temperature fluctuations on NIR models. After assessing the viability of using NIR spectroscopy to record NIR spectra on the transverse, radial, and tangential surfaces in order to estimate the moisture content of recently harvested oak wood, Defo et al. (2007) [13] came to the conclusion that the transverse surface produced the best model statistics. Comprehensive literature on the NIR band allocations for wood and wood components was reviewed by Schwanninger et al. (2011) [14]. The state of the art in NIRS applications for real-time solid wood moisture content and density monitoring was reviewed. As long as the spectrometer measures the 1450 nm and 1900 nm water absorption bands, as in the majority of the investigations, the prediction of moisture content is not significantly influenced by the spectral range employed (Adedipe and Dawson-Andoh, 2008) [15]. Because derivative spectra can be used to reduce the influence of wood density on NIR spectra, at least when the sample is above the fiber saturation threshold, NIRS can be used to determine wood moisture content independently of density (So et al. 2004). The moisture content of the sapwood of western red cedars (Thuja plicata Donn ex D. Don) was estimated by Cooper et al. (2011) [16] using NIRS.
Sorting kiln-dried wood for close-range moisture content has always remained a tedious task. A kiln batch’s final moisture content may not fall within a specified range during kiln drying. This might be caused by multiple differences in initial moisture contents, wood from various geographic regions, variations in the quality of the wood within a tree, etc. Sorting the kiln-dried wood thus becomes a crucial stage in industrial production. For businesses that use wood as a raw material, the predictive models in this work may be helpful for evaluating wood moisture and its fluctuations in real time. For example, in an industrial kiln, it would be feasible to immediately assess the variation in moisture content between recently dried wood planks. Additionally, managers could choose wood pieces on autopilot that are suitable for adhesives or surface finishing of the products based on their moisture content. To determine if the wood moisture content has already reached the appropriate level for furniture manufacture or trading, predictive algorithms may be employed.
The water in wood is never distributed uniformly, and moisture gradient is formed as drying progresses [27]. This moisture gradient becomes steeper as thickness is increased. The NIR penetration ability is limited to the wood surface. Hence, the effect of thickness becomes significant in the prediction of moisture content using such techniques, as the moisture content on the wood surface is lower than that of the wood core. Literature review on the subject suggests that the aspect of the effect of the thickness on the accuracy of the NIRS is yet to be addressed. In view of the above, the present work aims to extend the studies carried out on the NIR’s ability to not only predict moisture content in wood but also investigate its accuracy on varying the thickness of the wood. The current study is centred on the evaluation of the suitability of NIRS for real-time sorting of kiln-dried wood with a broad range of thicknesses and moisture content.
Materials and Methods
Wood specimens
The Forest Research Institute, Dehradun, India (30°20′42′′N 78°01′44′′E) cultivated Melia dubia plantations. The area receives 2073.3 mm of rainfall on average annually, with the months of July and August seeing the most precipitation. The site’s soil has a texture ranging from silty loam to silty clay, is highly organic carbon-rich, and is acidic to nearly neutral. Site elevation is 410 meters. The average summer temperature is 16.7 to 36oC, whereas the average winter temperature is 5.2 to 23.4oC. The plantation had 3 m x 3 m pure planting spacing (1050 trees/ha). For the investigation, seven-year-old, two trees of the same progeny were selected based on a straight, and defect-free-trunk appearance. The trees’ average height was 16.6 meters. The mean diameter at breast height (DBH) was 24 cm. After being felled, the trees were cut into 1.5 m round log lengths and were flat-sawn into different thicknesses of sawn wood. The thicknesses of the sawn-wood were 8 mm, 13 mm, 18 mm, 23 mm, 28 mm, 33 mm, 38 mm, and 48 mm. The final thicknesses of the boards were 5 mm, 10 mm, 15 mm, 20 mm, 25 mm, 30 mm, 35 mm, and 45 mm after they were passed through a planer machine. The clear and defect-free planks were further cut into 50 mm x 50 mm2 wooden blocks from each thickness, as indicated in Table 1. From the time the trees were felled until the final thicknesses were planned and sawn, it took around three months. After the planning, the specimens were submerged in water for 24 h. Thereafter, they were placed in a ventilated room for another one day before the first set of spectra was recorded. All the wooden blocks were weighed and absorption spectra through NIR instrument were taken immediately. Thus, as the drying of the wooden blocks continued, NIR spectra and weights were recorded subsequently.
NIR measurement and wood moisture content determination
FT-NIR spectrophotometer (Brucker, MPA) with wavelength range between 12820 cm-1 and 4000 cm-1 (780-2400 nm) was used for spectra recording. The instrument works in diffuse reflectance mode (resolution: 8 cm-1, detector: Pbs). Spectra of solid wood samples were taken using probe of the instrument. Since, for the industrial applications, tangential surfaces of the wood are easily available, two positions from both the tangential surfaces were used to take the NIR spectra. Each position was used to collect four scans, and the eight scans total were averaged into a single spectrum in order to account for the natural variation in the sample. The specimens were placed in an oven at temperature of 40oC for drying. The weights and spectra of the test specimens were taken intermittently at an interval of 24 h. After three rounds of weighing and recording spectra, the test specimens were kept at 103±2 oC, in oven for 24 h till the test specimens achieved oven dried weights (till the weights became constant). The oven dried weights were used to calculate the actual MC of each wood block. The moisture content was calculated using following expression:
MC(%) = (Gw-OD)/OD Χ100
MC= Moisture content
Gw= Green weight of the moisture strip
OD= Oven-dried weight of the moisture strip
PCA scores
Data can be made less dimensional while maintaining as much variance as feasible through the use of PCA. The original variables are changed into a set of principle components, which are uncorrelated linear combinations. The Unscrambler 10.2 (CAMO, Norway) software was used for computing of PCA scores and its presentation to project the data into the sub-space.
Development of calibration model
OPUS 6.5 software was used for multivariate analysis and the development of the NIR spectrum based calibration model. For the development of calibration model, out of entire NIR spectral range (12820 cm-1 to 4000 cm-1), a range of 5200-7300 cm-1 wave numbers in the spectral region was selected, as most of the water (-OH) related vibrations are found to occur in this region [14].
The spectrum was pre-processed using the transformation Savitzky-Golay 2nd derivative transformation with 17 smoothening points as other pre-processing tools like first derivative, Standard Normal Variate (SNV) and Multiplicative scatter correction (MSC) did not yield better results than 2nd derivative transformation. Multivariate analysis was carried out using partial least square (PLS) regression analysis method to develop predictive model based on broad moisture content range. For development of the model, wooden blocks of all thicknesses with all MC ranges along with the corresponding spectra were taken for PLS multivariate analysis. Using the built-in features of the OPUS software, cross-validation was carried out to determine the prediction accuracy of regression model. The error between the predicted and actual values for the testing set was then calculated to get the RMSECV.
The root mean square error (RMSE) and Ratio of performance deviation (RPD) can be presented as in following equations [15]:
RMSE
Where,
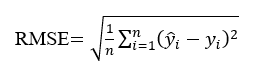
n = number of samples in the calibration set
=The measured responses,
=The estimated responses obtained through cross-validation or through test samples
Where,
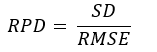
SD= Standard deviation of the calibration or the test samples
Table 1 presents specimen thickness, and the number of specimens used in calibration and testing of the model.
|
Specimens thickness |
Number of the specimens in used in calibration of the model | Number of the specimens used in testing of the model |
| 5 mm | 132 | 30 |
| 10 mm | 100 | 30 |
| 15 mm | 101 | 30 |
| 20 mm | 40 | 43 |
| 25 mm | 39 | 30 |
| 30 mm | 111 | 40 |
| 35 mm | 44 | 40 |
| 45 mm | 117 | 40 |
| Total | 684 | 283 |
Table 1: Details of the test specimens used for calibration and validation of NIR model.
Thus, total 967 number of the specimens were divided into a ratio of 70:30 for calibration and test specimens.
Testing the model
The spectra of the wood samples of mentioned thicknesses were recorded and run through the developed model to obtain the predicted MC%. Actual MC% of these samples were determined by conventional method. A comparative analysis of actual and predicted moisture contents was done. The test specimens (n=283) were segregated in three groups: first group included test specimens in all moisture content range i.e. below 25% and above 25%, second group included test samples with moisture content less than 25% and the third one consisted of test specimens with moisture content above 25%. Actual versus predicted moisture content plots were plotted using MS-Excel. R2 of the prediction and RMSEP were determined for the plots. Using the test specimen data (that were not used for calibration), RMSEP was calculated by taking the difference between the values that were predicted and those that were actual for these samples. The actual MC (oven dried weight basis) and corresponding predicted MC were used to analyse the robustness of the calibration model using statistical parameters like R2, RMSEP and RPD values.
Analyses of variance (ANOVA) was carried out to compare between various wood thickness with the respect to their values of absolute deviations in moisture content between predicted and actual values. A post hoc analysis (Duncan’s post hoc test) test was also carried out to find out which thicknesses’ absolute moisture content deviation belonged to same class and which classes differed.
Results and discussion
The NIR spectral profile and Principal Component Analyses (PCA)
Fig. 1 presents wood raw spectral distribution at low and high moisture content. The most prominent attribute that represents water is the OH overtone in the NIR spectra. The characteristic absorption bands at 7,692 cm-1 –6,900 cm-1 wave number are due to overtones of OH, corresponding to the moisture content in the samples [17]. Figure 1 illustrates the OH overtones in the spectral region around 7,000 –6,900 cm-1. These bands represent the moisture content present in the wood specimens. It is evident from figure 1 that the change in MC of the samples also affected the peak of OH overtone bands. The absorption peak of samples with lower moisture content (13-16%) have lower absorbance (represented as red colour) than that of the same samples having higher moisture content (above FSP) as represented as blue colour.
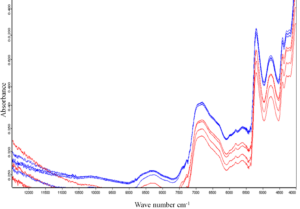
Figure 1: Spectral profile of 5mm thick wood samples at lower (25% and below) and higher (above 25%) moisture content.
Before developing the PLS model, a Principal Components Analysis (PCA) was applied to the spectral range of 5200 cm-1 to 7300 cm-1 the spectra acquired after the Savitzky-Golay 2nd derivative transformation. Figure 2 illustrates the score plot of the calibration set, where the first two principal components account for 93% of the variance in the original data set. Notably, the score plots for PC1 and PC2 reveal a clear clustering tendency. Consequently, the calibration set is deemed suitable for establishing moisture content variation in wood specimens through NIR. Distinctions are observed among the various moisture classes, with especially 10-15%, 15-30%, and higher moisture content, like 30-45%, above 45%. Above 30% moisture content, both classes show an overlapping tendency. Moisture content classes 10-15% and 15-30% are located closely but show separation tendency.
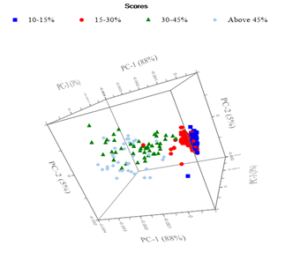
Figure 2: 3D representation of PCA scores.
The Calibration Model
Figure 3 presents the PLS model developed with the help of total 684 test specimens of various thicknesses with a broad range (low and high MC) of MC. Many wood specimens showed abnormally higher MC than rest of the specimens due to factors like nearness to the pith region, partial fungal infections. Most of the such specimens were found to be outliers during model development. Before removing all the outliers (n = 76, 11.1% of the total), R2, RMSECV and RPD values were 0.824, 7.01 and 2.39. These values improved to 0.966, 2.18 and 5.41 respectively after removing the outliers.
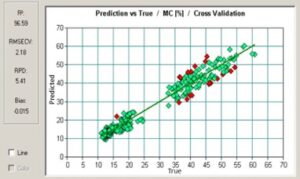
Figure 3: Calibration model for MC prediction developed using OPUS 6.5.
As per the classification of Williams (2014) [18], RPD value equal to or more than 4.1 is classified as ‘excellent’ model and can be used for any application e.g. quality and process control. It has also been suggested that models with RPD > 5 are good for quality control [19]. Thus, the results obtained indicate that a very robust model for MC prediction was developed. The results are comparable with the PLS models developed by Sundaram et al. (2015) [20] with RPD and R2 values 4.46 and 0.95 for the moisture content range of 0.63% to 14.16%.
Figure 4 presents frequency diagram (cross validation) of MC deviations from actual MC of test specimens (n=608) in cross validation of the model. The mean deviations (absolute values) were found to be 1.53 for all the thickness and MC ranges.
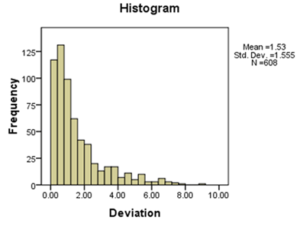
Figure 4: MC% deviations from actual to calibrated model.
The outliers omitted from the model belonged to higher moisture content class (25% to 125%) with mean value 52.18%. Most of the outliers had MC% approximately 50%. The fact that no outliers belonged to lower MC class (less than 25%), is an indicator that the model will show high degree of residuals during validation of higher MC class wood specimens. Figure 5 presents absolute deviation between the actual MC% values and calibration model.
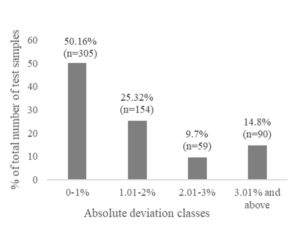
Figure 5: Absolute deviation classes, percentage of the specimens and number of the specimens (n).
From Fig. 5, it can be seen that MC% deviations (absolute values) ranged from 0-1% for approximately half (50.16%) of the specimens used in development of calibration model, followed by 25.32% of the specimens ranged MC deviations from 1.01 to 2%. Thus, 75% of the specimens showed absolute deviation by less than 2% MC. A very small fraction of the test specimens (less than 10%) deviated in MC from 2.01-3%. Approximately 15% of the test specimens’ absolute MC deviation from actual values was more than 3%.
Testing the model for MC prediction
NIR spectra of the test specimens of various thicknesses (Table 1) were used to predict the MC using the model. Figure 6 presents the plot for actual MC vs. predicted in broad MC range (both lower and higher MC). It can be seen that Rp2 for the relationship is 0.775 with a broader RMSEP value (5.34). 64.3 % (n=175) of the validation samples MC were overestimated by average 1. 6%± 1.56, whereas, 35.7 % (n=97) of the samples MC were underestimated by 5.8 %± 6.11.
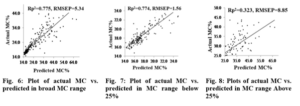
As presented in Fig. 7, the model predicted the test samples with MC% below 25% more accurately (RMSEP=1.56). Out of the total, 86.6% of the test samples were overestimated by average 1.36%±0.81, whereas, 13.4% of the samples underestimated by 1.06%±1.09. In contrary to this, when the test samples with MC% more than 25% were put into the model (Fig. 8), 77.2% of the test specimens were under estimated by average 7.7%±6.23, whereas, 22.8% samples overestimated by average 2.88%. Thus, by and the large, the model shows significant error in estimation (under-estimation) for the samples with MC% more than 25%. The two spectral peaks at 6993 cm-1 (1430 nm) and 5236 cm-1 (1910 nm), which are attributed to OH absorption are due to water [22]. However, the prediction of moisture content is not deeply influenced by the spectral range used, as long as the spectrometer measures the 6897 cm-1 and 5263 cm-1 water absorption bands [22]. Since, in this study the spectral range used for the model development taken was 7299 cm-1 to 5200 cm-1, the possibility of error due to selection of spectral range looks weak. It was also pointed out that the PLS regression model tended to underestimate moisture content ranging from 35% to 105% as measured content increased [23]. The non-linearity between actual and predicted MC maybe attributed to the result of steep moisture gradient i.e. non-uniformity in moisture distribution across the thickness.
Effect of thickness
Table 2 presents mean deviation of the predicted MC% from actual values, RMSEP, for each thickness group (n=8) under two broad categories: MC% less than 25% and MC more than 25%. It can be seen that Mean deviation (absolute value) from Actual MC % and RMSEP of two MC based broad groups are distinct from each other. The range of the mean deviation from actual MC for less than 25% of the MC is 0.7-1.75%, while the mean deviation for more than 25% of the MC is generally larger (2.2-8.87%).
All of the data show that the created NIR model could only reliably estimate moisture content when the moisture content was less than 25%. This also indicates that NIRS prediction ability at higher moisture content is reduced.
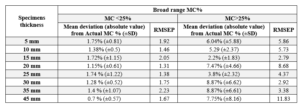
Table 2: Wood thickness and predicted MC%.
An interesting trend is observed in both the categories of validation moisture contents; below and above 25% as shown in table 4. The test samples below 25% MC were largely over estimated (OE), whereas, above 25% test specimens were largely underestimated by the model. The proportion of the over/ under estimated specimens was very high (approximately 100%) when the thickness was lower (5-15 mm), whereas, as the thickness increased, proportion also decreased. For example, when 45 mm thick test specimens were used below 25%, proportion of overestimated test specimen was only 73.3%, while for that of above 25%, it was 71.4%.
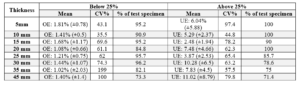
Table 3: Predicted MC below and above 25% for different thicknesses.
The extent of over-estimation of test samples with lower MC, was very low and ranged from 1-1.81% with lower SD, whereas, for higher MC%, extent of under estimation was very high (2.48-11.02% with higher SD). This indicates inability of NIR radiation to penetrate deeper in the wood. The penetration of NIR radiation in solid wood ranges between 1 mm to 5 mm [24-25]. During drying, the uppermost surfaces of wood dry very fast while deeper layers of the wood still remain at very high MC. Coefficient of variation (CV%) in Table 3 shows that for below 25% MC, CV% varied from 35.5 to 199.0%, whereas for above 25% MC it varied from 44.8% to 97.4%. CV% for below 25% MC shows lower values for lower thicknesses and higher value for higher thicknesses.
The absolute deviations in moisture content between predicted and actual values were used for ANOVA analysis to find out if these deviations in moisture of different wood thicknesses belonged to same population (Null hypothesis) or were significantly distinct from each other (Alternate hypothesis). A post hoc analysis (Duncan’s post hoc test) test was also carried out. The results indicated that the null hypothesis was not accepted and alternate hypothesis was found to be true. The deviations in MC depended upon the thickness (n= 283, df=7, F=5.767, p<0.001). Duncan’s post hoc analysis resulted into four sub-sets, out of which two sub-sets (5 mm, 10 mm and 15 mm in sub-set 1 and 30 mm, 35 mm and 45 mm in sub-set 4) were distinctly placed away from each other.
| Specimen thickness | N | Subset for alpha = 0.05 | |||
| Sub-set 1 | Sub-set 2 | Sub-set 3 | Sub-set 4 | ||
| 10 mm | 30 | 2.96 | |||
| 5 mm | 30 | 3.58 | 3.58 | ||
| 15 mm | 30 | 1.94 | 1.94 | ||
| 20 mm | 43 | 3.87 | 1.32 | ||
| 25 mm | 30 | 2.42 | |||
| 30 mm | 40 | 6.12 | |||
| 45 mm | 40 | 5.84 | |||
| 35 mm | 40 | 4.82 | |||
| Sig. | 0.096 | 0.088 | 0.263 | 0.061 | |
| Means for groups in homogeneous subsets are displayed. | |||||
Table 4: Duncan sub-sets (Post hoc test) for absolute deviation between actual and predicted values.
In subset 2 and 3, thicknesses sub-sets overlapped like 20 mm was placed. However, 25 mm thickness was placed in separate sub-set 3. However, it clearly indicates that absolute deviation for higher and lower thicknesses are significantly different from each other. The reason attributed to the dependence of accuracy of a NIR model on thickness may again be moisture gradient. Thicker the section, steeper will be moisture gradient. This difference in the moisture content between core and shell layers may lead to some serious flaws in prediction of higher MC levels. Limited penetration can result to a large variation in model predictability and leads to strong dependence on sample thickness [26].
Conclusion
A partial least square (PLS) model based on NIR for the prediction of moisture content (MC) in the wood of Melia dubia was developed. Statistical analyses showed that the deviations in moisture content % from the actual values significantly depended upon the thickness of the wood. The chemo-metric model showed high analytical performance with a R2, RMSECV and RPD values for the calibration model were 0.966, 2.18 and 5.41 respectively. Coefficient of determination for prediction (Rp2) was 0.775 with a broader RMSEP value (5.34) when broad moisture content range of validation samples were used. The model predicted the test samples with MC% below 25% with Rp2, RMSEP values 0.77 and 1.56. The test samples below 25% MC were found to be largely over estimated (OE), whereas, above 25% validation specimens showed largely under estimated through the model. The results indicated that the developed NIR model can predict moisture content accurately for moisture content below 25%. For higher ranges of MC, the accuracy of the model diminished significantly. The moisture content prediction ability of NIRS is also influenced by the specimen thickness. In the industrial manufacturing, NIRS-based predictive algorithms can incorporate factors such as moisture content and wood thickness, as the study shows that the feasibility of using NIRS to assess the variation in moisture content for adhesives or surface finishing products, furniture manufacture or trading, etc. is limited by these factors. Prediction accuracy is higher at lower moisture and wood thicknesses than at higher moisture and higher thicknesses.
Acknowledgement: The author is thankful to Indian Council of Forestry Research and Education (ICFRE), Dehradun (India) for funding support.
Conflict of Interest: No conflict of interest was reported by the author.
References
- Bec KB, Grabska J, Huck CW(2021) Principles and applications of miniaturized near‐infrared (NIR) spectrometers. Chemistry–A European Journal 27(5): 1514-1532.
- Tsuchikawa S, Inoue K, Noma J, et al. (2003) Application of near-infrared spectroscopy to wood discrimination. J Wood Sci 49: 0029–0035.
- Kothiyal V, Raturi A (2011) Estimating mechanical properties and specific gravity for five-year-old Eucalyptus tereticornis having broad moisture content range by NIR spectroscopy. Holzforschung 65(5): 757-762.
- Sandak J, Sandak A and Roger M (2016) Assessing trees, wood and derived products with near infrared spectroscopy: hints and tips. Journal of Near Infrared Spectroscopy 24: 485-505.
- Giroud G, Defo M, Begin J, Ung C (2015) Application of near infrared spectroscopy to determine juvenile-mature wood transition in black spruce. Forest Products Journal 65(3-4): 129-138.
- Lazarescu C, Hart F, Pirouz Z, Panagiotidis K, Mansfield SD, Barrett JD, et al. (2017) Wood species identification by near-infrared spectroscopy. International Wood Products Journal 8(1): 32-5.
- Fujimoto T, Kurata Y, Matsumoto K, Tsuchikawa S (2010) Feasibility of near-infrared spectroscopy for online multiple trait assessment of sawn lumber. Journal of wood science 56: 452-9.
- Watanabe K, Hart F, Mansfield SD, Avramidis S (2010) Near infra-red technology applications for quality control in wood processing. In: Proceedings of the COST E53 Conference 2010, Edinburgh, UK, pp 332–341.
- Prieto N, Pawluczyk O, Dingan MER, Aalhus JL (2017) A review of principles and applications of near- infrared spectroscopy to characterize meat, fat and meat products. Applied Spectroscopy 7(7): 1403-1426.
- Minasny B. Why calculating RPD is redundant. 2013. You don’t need to calculate RPD (Ratio of Performance to Deviation).
- Lestander TA, Rhen C (2005) Multivariate NIR spectroscopy models for moisture, ash and calorific content in biofuels using bi-orthogonal partial least squares regression. The Analyst 130: 1182-1189.
- Thygesen LG, Lundqvist SO (2000) NIR measurement of moisture content in wood under unstable temperature conditions. Part 2. Handling temperature fluctuations. Journal of Near Infrared Spectroscopy 8(3):191-9.
- Defo M, Taylor AM, Bond B (2007) Determination of moisture content and density of fresh-sawn red oak lumber by near infrared spectroscopy. Forest Products Journal 57(5): 68.
- Schwanninger M, Rodrigues JC, Fackler K (2011) A review of band assignments in near infrared spectra of wood and wood components. Journal of Near Infrared Spectroscopy 19(5): 287-308.
- Adedipe OE. and Dawson-Andoh B (2008) Predicting moisture content of yellow-poplar (Liriodendron tulipifera) veneer using near infrared spectroscopy. Forest Products Journal 58(4): 28-33.
- Cooper PA, Jeremic D, Radivojevic S, Ung YT, Leblon B (2011) Potential of near-infrared spectroscopy to characterize wood products. Canadian Journal of Forest Research 41: 2150–2157.
- Yi J, Sun Y, Zhu Z, Liu N, Lu J (2017) Near-infrared reflectance spectroscopy for the prediction of chemical composition in walnut kernel. International Journal of Food Properties 20(7): 1633-42.
- Williams P, Norris K (1987) Near-infrared technology in the agricultural and food industries. American Association of Cereal Chemists, Inc.
- Ritthiruangdej P, Ritthiron R, Shinzawa H, et al. (2011) Non-destructive and rapid analysis of chemical compositions in Thai steamed pork sausages by near infrared spectroscopy. Food Chemistry 129(2): 684-692.
- Sundaram J, Mani S, Kandala CVK, et al. (2015) Application of NIR Reflectance Spectroscopy on Rapid Determination of Moisture Content of Wood Pellets. American Journal of Analytical Chemistry 6: 923-932.
- Karttunen K, Leinonen A, Sarén MP (2008) A survey of moisture distribution in two sets of Scots pine logs by NIR-spectroscopy. Holzforschun 62: 435–440.
- Leblon B, Adedipe O, Hans G, Tsuchikawa S, Burger J, Rod S, Pirouz Z, Groves K, Nader J, et al. (2013) A review of near-infrared spectroscopy for monitoring moisture content and density of solid wood. The Forestry Chronicle 89 (5): 595-606.
- Watanabe K, Mansfield SD, Avramidis S (2011) Application of near-infrared spectroscopy for moisture-based sorting of green hem-fir timber. J Wood Sci 57: 288–294.
- Tsuchikawa S, Torii M, Tsutsumi S (1996) Application of near-infrared spectrophotometry to wood. 4. Calibration equations for moisture content. Mokuzai Gakkaishi 42: 743–754.
- Tsuchikawa S, Torii M, Tsutsumi S (2001) Directional characteristics of near-infrared light reflected from wood. Holzforschung 55: 534–540.
- Park SY, Kim JC, Yeon S, et al. (2018) Rapid Prediction of the Chemical Information of Wood Powder from Softwood Species Using Near-Infrared Spectroscopy. BioResources 13(2), 2440-2451.
- Rosenkilde A (2002) Moisture content profiles and surface phenomena during drying of wood (Doctoral dissertation, Byggvetenskap), 2002. Kungliga Tekniska Högskolan, 100, 44, STOCKHOLM. TRITA-BYMA.