

Density functional theory studies, experimental investigations (FT IR, FT Raman), in vitro assay studies and molecular docking studies on 3-acetamidotetrahydro-2-thiophenoneDona Benny, Johanan Christian Prasana*
Dona Benny, Johanan Christian Prasana*
Department of Physics, Madras Christian College, East Tambaram, Chennai, 600059, Tamilnadu, India
*Correspondence to: Johanan Christian Prasana
Citation: Benny D, Prasana JC (2025) Density functional theory studies, experimental investigations (FT IR, FT Raman), in vitro assay studies and molecular docking studies on 3-acetamidotetrahydro-2-thiophenone. Sci Academique 6(1): 47-68
Received: 10 March, 2025; Accepted: 7 April, 2025; Published: 16 April, 2025
Abstract
This work investigates the compound, 3-Acetamidotetrahydro-2-thiophenone computationally, and obtained results are compared experimentally. Given its efficiency and cost-effectiveness, DFT calculations (B3LYP functional) with a suitable basis set were utilized to determine stable, minimum-energy structure of the compound. Experimental and theoretical FT-IR and FT-Raman spectra were compared. To elucidate electronic properties, various theoretical studies were conducted. Additionally, topological analysis was performed to assess molecular structure. To evaluate potential biological activity, drug-likeness, and molecular docking studies were carried out. In vitro cytotoxicity assays were conducted. Results suggest that 3-acetamidotetrahydro-2-thiophenone exhibits anti-emphysema and holds promise as a potential therapeutic agent for emphysema.
Keywords: Dft; Thiophenone moiety; Vibrational assignments; Molecular docking; In vitro assay studies
Introduction
Thiophene has emerged as a prospective entity in the rapidly expanding field of heterocyclic compounds with its intriguing pharmacological properties [1]. Thiophene is a heteroaromatic molecule with five members and one sulphur atom. Thiophene derivatives are significant heterocycles in medicinal chemistry that have remarkable applications [2]. Thiophene derivatives exhibit anticancer action [3], antihypertensive [4], analgesic and anti-inflammatory [5], and antibacterial [6] activities. Tetrahydrothiophene is also termed as Thiophane which is a saturated thiophene [7]. Since nitrogen heterocycles have been thoroughly studied in medicinal chemistry, researchers’ focus has switched to other heterocycles, particularly S-heterocycles. Compounds containing S-heterocycles have been widely documented to have anti-inflammatory, anti-cancer, anti-diabetic, antibacterial, antihypertensive, and antiviral properties up to this point. Raloxifene, is a heterocyclic compound with sulphur that has FDA approval and is used as a popular medication for breast cancer. Thiabendazole is an antifungal medication. Rosiglitazone is clinically used to treat diabetes, clopidogrel is used to treat peripheral artery diseases and ritonavir is a strong antiviral agent [8].
Thiophene moiety has acquired attention for its diverse applications. This study focuses on 3-acetamidotetrahydro-2-thiophenone (C6H9NO₂S) of Molecular weight 159.20 g/mol. The title compound has not been previously investigated using DFT or molecular docking. To analyze potential applications of this compound, conducted a comprehensive analysis involving structural characterization, spectroscopic analysis, and biological evaluation. DFT studies were done to elucidate the molecular structure of 3-acetamidotetrahydro-2-thiophenone. Additionally, theoretical and experimental spectroscopic analyses were performed to validate structural, electronic information. To assess the compound’s biological potential and pharmaceutical relevance, biological assays were conducted.
Experimental Details
3-acetamidotetrahydro-2-thiophenone compound was obtained from Tokyo Chemical Industry Co., Ltd., with a purity exceeding 98%. Experimental analyses, including FT-IR, FT-Raman, were conducted at the SAIF, IIT Madras. FT-IR spectrum (4000-400 cm⁻¹) was recorded using KBr pellet preparation. FT-Raman spectrum (4000-100 cm⁻¹) was obtained. In vitro cytotoxicity and biological activity of 3-acetamidotetrahydro-2-thiophenone were evaluated against the human lung carcinoma (A549) cell line at Radiant Research Services Pvt. Ltd., Bangaluru, India.
Computational Details
DFT calculations using Gaussian 16W [9] and GaussView 05 [10] software packages were performed [9, 10]. 6-311G++(d,p) is the basis set employed. Vibrational frequency analysis was conducted using VEDA software [11]. Wavefunction analysis was performed using Multiwfn 3.8 software [12]. Drug-likeness properties were evaluated using the online SwissADME program. To assess the bioactivity of 3-acetamidotetrahydro-2-thiophenone, the PASS online tool was utilized [13]. Molecular docking using Autodock Tools 1.5.6, and visualization using Discovery Studio was carried out [14, 15].
Results and Discussion
Molecular Geometry
Optimized structure of 3-acetamidotetrahydro-2-thiophenone, corresponding to a highly stable, minimum-energy conformation, was determined using DFT. Bond lengths, bond angles of headline compound were calculated, and optimized geometry is presented in figure. 1 and Table 1 [16]. Maximum bond length was observed between sulphur and carbon atoms might be due to the larger size of sulphur than the carbon atoms surrounded. S1–C7 bond exhibited the maximum bond length of 1.815 Å and S1-C8 is 1.765 Å. Carbon-carbon bonds in the ring structure are found to be 1.5 Å. There are two carbon-oxygen bonds, O2-C8, and O3-C9, which exhibit bond lengths of 1.221 and 1.227 Å respectively. N4-H16 bond was the shortest, measuring 1.017 Å. Largest bond angle identified was 126.3° between O2-C8-C5. Smallest bond angle, 93.8°, was observed between C7-S1-C8 atoms [17].

Figure 1: Optimized structure of 3-Acetamidotetrahydro-2-thiophenone.
| PARAMETER | Values |
| BOND LENGTH(Å) | |
| S1-C7 | 1.815 |
| S1-C8 | 1.765 |
| O2-C8 | 1.221 |
| O3-C9 | 1.228 |
| N4-C5 | 1.434 |
| N4-C9 | 1.391 |
| N4-H16 | 1.017 |
| C5-C6 | 1.525 |
| C5-C8 | 1.51 |
| C5-H11 | 1.096 |
| C6-C7 | 1.518 |
| C6-H12 | 1.096 |
| C6-H13 | 1.099 |
| C7-H14 | 1.093 |
| C7-H15 | 1.094 |
| C9-C10 | 1.505 |
| C10-H17 | 1.094 |
| C10-H18 | 1.093 |
| C10-H19 | 1.094 |
| Bond angle (◦) | |
| C7-S1-C8 | 93.8 |
| S1-C7-C6 | 103.7 |
| S1-C7-H14 | 111.2 |
| S1-C7-H15 | 109.3 |
| S1-C8-O2 | 123 |
| S1-C8-C5 | 110.6 |
| O2-C8-C5 | 126.3 |
| O3-C9-N4 | 125.5 |
| O3-C9-C10 | 121.8 |
| C5-N4-C9 | 123.6 |
| C5-N4-H16 | 118 |
| N4-C5-C6 | 112.3 |
| N4-C5-C8 | 109.2 |
| N4-C5-H11 | 110.1 |
| C9-N4-H16 | 118.4 |
| N4-C9-C10 | 112.6 |
| C6-C5-C8 | 106 |
| C6-C5-H11 | 110.7 |
| C5-C6-C7 | 107.3 |
| C5-C6-H12 | 111.2 |
| C5-C6-H13 | 110.8 |
| C8-C5-H11 | 108.5 |
| C7-C6-H12 | 111.1 |
| C7-C6-H13 | 110 |
| C6-C7-H14 | 112.1 |
| C6-C7-H15 | 111.2 |
| H12-C6-H13 | 106.5 |
| H14-C7-H15 | 109.2 |
| C9-C10-H17 | 109.7 |
| C9-C10-H18 | 109.4 |
| C9-C10-H19 | 110.4 |
| H17-C10-H18 | 109.3 |
| H17-C10-H19 | 108.6 |
| H18-C10-H19 | 109.5 |
Table 1: Optimized molecular geometry of 3-Acetamidotetrahydro-2-thiophenone.
Vibrational Analysis
Vibrational spectroscopy is a valuable tool for identifying functional groups within molecules. 3-acetamidotetrahydro-2-thiophenone has 51 vibrational modes (3n-6). This study compares experimental (FT-IR, FT-Raman) with theoretical spectra. Calculated frequencies were scaled (0.961) to improve agreement with experimental data. Theoretical and experimental spectra exhibit excellent correlation, as shown in Figures 2, 3. Vibrational assignments are listed in Table 2 [18]. N-H stretching vibration creates a band between 3500 and 3300 cm−1 [19]. A peak at 3447 cm−1 was obtained theoretically. C-H stretching vibrations are present in the 3000–3100 cm-1 range [20]. At 3016 cm-1, FT IR experimental peak was seen and at 3015 cm-1, FT Raman peak was seen. Theoretical peak was also within the range. Desired region of C-O stretching is between 1740 to 1660 cm-1 [21]. Experimental FTIR peaks are at 1761 and 1692 cm-1. FT Raman (exp) peaks were seen at 1693, 1652 cm-1. Theoretically obtained peaks (1705, 1670 cm-1) are also within the range [22].
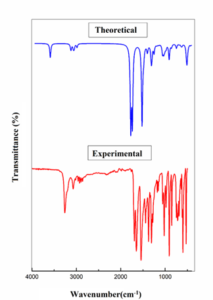
Figure 2: FT-IR spectra of 3-Acetamidotetrahydro-2-thiophenone.
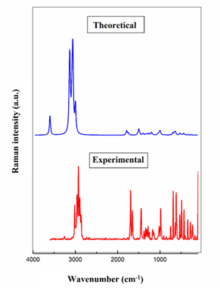
Figure 3: FT-Raman spectra of 3-Acetamidotetrahydro-2-thiophenone.
| Modes | Exp FTIR | Exp FTR | unscaled | scaled | abs | rel | abs | rel | Vibrational assignents |
| 51 | 3587 | 3447 | 17 | 57 | 36 | 64 | ϒ NH (100) | ||
| 50 | 3016 | 3015 | 3129 | 3007 | 2 | 6 | 45 | 81 | ϒ CH (90) |
| 49 | 3122 | 3000 | 4 | 14 | 33 | 58 | ϒ CH (90) | ||
| 48 | 3117 | 2995 | 1 | 5 | 41 | 73 | ϒ CH (97) | ||
| 47 | 3115 | 2993 | 1 | 4 | 48 | 85 | ϒ CH (100) | ||
| 46 | 2959 | 2959 | 3068 | 2948 | 5 | 17 | 59 | 105 | ϒ CH (96) |
| 45 | 3052 | 2933 | 4 | 12 | 53 | 94 | ϒ CH (97) | ||
| 44 | 2927 | 3045 | 2927 | 2 | 6 | 100 | 178 | ϒ CH (99) | |
| 43 | 2825 | 2985 | 2869 | 5 | 15 | 51 | 91 | ϒ CH (98) | |
| 42 | 1761 | 1693 | 1774 | 1705 | 100 | 329 | 8 | 15 | ϒ CO (92) |
| 41 | 1692 | 1652 | 1738 | 1670 | 93 | 306 | 4 | 8 | ϒ CO(82) |
| 40 | 1542 | 1520 | 1461 | 98 | 324 | 1 | 2 | ϒ NC (22)+β HNC(50) | |
| 39 | 1440 | 1445 | 1501 | 1442 | 1 | 2 | 2 | 3 | β HCH(92) |
| 38 | 1490 | 1431 | 2 | 7 | 6 | 11 | β HCH(85) | ||
| 37 | 1486 | 1428 | 11 | 36 | 3 | 5 | β HCH(68)+ τ HCCN (21) | ||
| 36 | 1473 | 1416 | 2 | 8 | 4 | 6 | β HCH(80)+ τ HCCN (13) | ||
| 35 | 1372 | 1376 | 1401 | 1346 | 9 | 29 | 1 | 2 | β HCH(87) |
| 34 | 1334 | 1338 | 1381 | 1327 | 1 | 3 | 2 | 4 | β HCN(16)+τ HCCS (52) |
| 33 | 1277 | 1282 | 1323 | 1271 | 1 | 5 | 1 | 3 | β HCN(17)+τ HCCS (45)+τ HCSC (11) |
| 32 | 1311 | 1260 | 18 | 60 | 1 | 1 | β HCC(22)+τ HCCS (24) | ||
| 31 | 1299 | 1248 | 11 | 35 | 1 | 3 | τ HCSC (42) | ||
| 30 | 1250 | 1202 | 11 | 35 | 3 | 6 | ϒ NC (14)+β HNC(22)+β HCN(21) | ||
| 29 | 1174 | 1191 | 1145 | 1 | 2 | 4 | 7 | β HCS(27)+β HCN(13)+β HCC(16) | |
| 28 | 1176 | 1180 | 1134 | 1 | 3 | 2 | 3 | ϒ NC (37)+ϒ CC (14) | |
| 27 | 1145 | 1100 | 1 | 3 | 1 | 2 | β HCC(14)+τ HCCS (10)+τ HCSC (12) | ||
| 26 | 1017 | 1059 | 1018 | 9 | 30 | 0 | 0 | ϒ CC (30)+β HCS(24)+β HCN(10) | |
| 25 | 1054 | 1056 | 1015 | 2 | 7 | 0 | 0 | β HCH(24)+τ HCCN (54)+ω OCNC (16) | |
| 24 | 1021 | 1032 | 992 | 9 | 31 | 3 | 5 | β HCS(13) | |
| 23 | 983 | 1012 | 972 | 6 | 19 | 1 | 3 | τ HCCN (35) | |
| 22 | 991 | 952 | 3 | 8 | 6 | 10 | ϒ CC (30) | ||
| 21 | 979 | 977 | 939 | 4 | 13 | 4 | 8 | ϒ CC (60) | |
| 20 | 906 | 910 | 874 | 19 | 62 | 1 | 1 | ϒ CC (16)+β OCS(11)+τ HCCS (10) | |
| 19 | 850 | 857 | 823 | 4 | 13 | 1 | 1 | β HCS(11)+τ HCSC (28)+τ HCCS (11) | |
| 18 | 746 | 748 | 745 | 716 | 5 | 18 | 1 | 1 | ϒ CC (26)+ϒ SC (16)+ω OCSC (12) |
| 17 | 684 | 687 | 684 | 657 | 1 | 3 | 4 | 7 | β CCC(27)+β SCC(24) |
| 16 | 638 | 653 | 628 | 0 | 1 | 1 | 2 | τ CCCC (12)+ω OCSC (13)+ω OCNC (14) | |
| 15 | 637 | 617 | 637 | 613 | 2 | 7 | 4 | 7 | ω OCNC (35) |
| 14 | 614 | 620 | 596 | 2 | 8 | 5 | 8 | ϒ CC (12)+β CCC(16)+ω OCSC (24)+ω OCNC (14) | |
| 13 | 526 | 539 | 522 | 501 | 9 | 28 | 3 | 6 | β OCC(40)+β CCC(16) |
| 12 | 488 | 507 | 488 | 21 | 69 | 0 | 0 | τ HNCC (81) | |
| 11 | 486 | 467 | 3 | 8 | 2 | 3 | β OCS(13)+β OCC(10)+β SCC(39) | ||
| 10 | 432 | 427 | 410 | 1 | 5 | 3 | 6 | ϒ SC (43)+β OCS(38) | |
| 9 | 400 | 384 | 1 | 4 | 1 | 1 | β CCC(10)+ω OCSC (28)+ω NCCC (29) | ||
| 8 | 342 | 334 | 321 | 0 | 1 | 1 | 2 | β CCN(43)+β CCN(12) | |
| 7 | 279 | 257 | 247 | 0 | 1 | 1 | 2 | β OCS(11)+β OCC(10)+β CNC(11)+β NCC(22) | |
| 6 | 231 | 217 | 208 | 1 | 2 | 0 | 0 | β CCC(10)+β CNC(10)+τ HCCS (12)+τ CCCC (29) | |
| 5 | 150 | 144 | 2 | 7 | 0 | 0 | β CNC(25)+τ CCNC (12)+τ SCCC (21) | ||
| 4 | 92 | 106 | 101 | 3 | 10 | 0 | 1 | β CNC(15)+β NCC(28)+τ CCNC (23) | |
| 3 | 71 | 84 | 81 | 1 | 5 | 0 | 1 | τ HCCN (10)+τ CCNC (24)+τ SCCC (32)+ωNCCC(11) | |
| 2 | 61 | 58 | 3 | 9 | 0 | 1 | τ HCCN (37)+τ CNCC (28)+τ CCNC (19)+ω OCNC (10) | ||
| 1 | 52 | 50 | 1 | 2 | 0 | 0 | τ HCCN (20)+τ CNCC (58) |
| ϒ- stretching, β – In plane bending, ω – Out of plane bending, τ – Torsion.
*Scaling factor 0.961 for B3LYP/6-311++G(d,p) basis set. ** Normalised to 100. |
Table 2: Experimental and calculated vibrational spectroscopic data with vibrational assignments on 3-Acetamidotetrahydro-2-thiophenone.
FMO
Molecular orbitals, particularly HOMO and LUMO, provide valuable insights into bioactivity of a molecule. The HOMO-LUMO energy gap is a key indicator of a molecule’s stability and reactivity. A smaller HOMO-LUMO gap generally correlates with higher reactivity, while a larger gap suggests greater stability [23-26]. Table 3 presents global chemical parameters of 3-acetamidotetrahydro-2-thiophenone, and Figure 4 illustrates HOMO-LUMO transitions. Gas-phase HOMO-LUMO energy gap is 6.088 eV. Furthermore, chemical softness and hardness values were calculated using global chemical parameters. Title compound exhibits increased stability due to its higher chemical hardness(3.044) and lower chemical softness (0.164) values. These results indicate that 3-acetamidotetrahydro-2-thiophenone is stable.
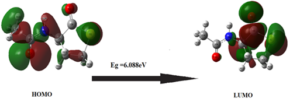
Figure 4: Frontier molecular orbital of 3-Acetamidotetrahydro-2-thiophenone.
| Parameter |
Values |
| HOMO (eV) | -7.365 |
| LUMO (eV) | -1.278 |
| Ionization potential | 7.365 |
| Electron affinity | 1.278 |
| Energy gap(eV) | 6.088 |
| Electronegativity | 4.321 |
| Chemical potential | -4.321 |
| Chemical hardness | 3.044 |
| Chemical softness | 0.164 |
| Electrophilicity index | 3.068 |
Table 3: Calculated energy values 3-Acetamidotetrahydro-2-thiophenone.
Molecular Electrostatic Potential
MEP map provides a three-dimensional, color-coded representation of electron density distribution and is applied to understanding electronic structure and reactivity of a molecule [27]. MEP highlights regions of high and low electron density, identifying potential electron-donor and acceptor sites. Regions in red on the MEP map indicate areas of electrophiles, while blue regions represent areas of nucleophiles. Green regions represent neutral areas. Figure 5 presents the MEP map for 3-acetamidotetrahydro-2-thiophenone. MEP scale ranges from -5.303e-2 to 5.303e-2. [28] Oxygen atoms (O2, 03) are seen in red color which is on the negative side of the scale showing its affinity for electrons. Other atoms are seen in neutral (green) and almost neutral regions in the MEP scale indicating the zero potential.
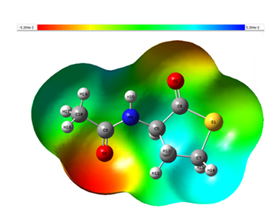
Figure 5: Molecular electrostatic potential of 3-Acetamidotetrahydro-2-thiophenone.
Non-Linear Optical Activity
Nonlinear optical (NLO) materials have significant potential applications in various fields, including medicine. NLO activity arises from interaction between electromagnetic fields and molecules. This study investigated NLO properties of 3-acetamidotetrahydro-2-thiophenone given in Table 4. Hyperpolarizability component is a key indicator of NLO activity in organic molecules. Compounds with higher hyperpolarizabilities are more likely to be effective NLO materials. Calculations were performed for x, y, and z components of Dipole moment, Polarizability, and First-order hyperpolarizability.
| parameters | Values |
| βxxx | 46.72 |
| βxxy | 26.32 |
| βxyy | -9.59 |
| βyyy | 10.70 |
| βzxx | -21.43 |
| βxyz | 2.486 |
| βzyy | 19.83 |
| βxzz | 41.36 |
| βyzz | 3.601 |
| βzzz | 32.167 |
| βtot (a.u) | 93.513 |
| βtot (e.s.u) | 8.07 E-31 |
| α xx | 128.90 |
| α xy | -4.64 |
| α yy | 104.82 |
| α xz | 0.616 |
| α yz | 2.597 |
| α zz | 74.957 |
| α (a.u) | 102.89 |
| α (e.s.u) | 1.52E-23 |
| ∆ α (a.u) | 228.11 |
| ∆ α (e.s.u) | 3.38E-23 |
| µx | 0.07 |
| µy | -0.35 |
| µz | 0.50 |
| µ (D) | 0.62 |
Table 4: Predicted dipole moment, polarizability, and first hyperpolarizability for 3-Acetamidotetrahydro-2-thiophenone.
Results show that 3-acetamidotetrahydro-2-thiophenone has a dipole moment of 0.62 (D), a polarizability of 102.89 atomic units (a.u), and a hyperpolarizability of 93.513 a.u. Notably, hyperpolarizability of 3-acetamidotetrahydro-2-thiophenone is significantly higher than that of urea, a commonly used reference molecule. These findings suggest that title compound exhibits promising NLO activity [29,30].
NBO Analysis
Natural bond orbital analysis was conducted to explore conjugative interactions or charge transfer in molecular systems. Using DFT, NBO analysis was carried out on title molecule to identify intramolecular rehybridization and delocalization of electron density in a molecule. Magnitude of stabilization energy reflects strength of the overall bonding structure and the molecule’s ability to donate electrons to acceptors. Table 5 summarizes NBO parameters. Highest observed stabilization energy of 32.31 kcal/mol occurs between S1 lone pair (LP 2) donor and O2-C8 acceptor. Stabilization energies of 1.01 kcal/mol were found between S1 (acceptor) and C5-C8 (donor), and 1.02 kcal/mol between S1 (acceptor) and C5-C7 (donor) [31,32].
| Donor | type | ED/e(qi) | Acceptor | type | ED/e(qi) | E(2) | E(j)-E(i) | F(i,j) |
| S1 – C 7 | σ | 1.98 | O2 – C 8 | π | 0.013 | 4.64 | 1.19 | 0.067 |
| S 1 – C 7 | σ | 1.98 | C 6 – H 12 | π | 0.014 | 1.99 | 1.01 | 0.04 |
| S 1 – C 8 | σ | 1.979 | N 4 – C 5 | π | 0.029 | 1.67 | 1 | 0.036 |
| S 1 – C 8 | σ | 1.979 | C 7 – H 14 | π | 0.014 | 0.67 | 1.04 | 0.024 |
| O 2 – C 8 | σ | 1.997 | C 5 – C 8 | π | 0.077 | 0.75 | 1.48 | 0.03 |
| O 2 – C 8 | σ* | 1.991 | C 5 – C 6 | π | 0.024 | 0.5 | 0.77 | 0.018 |
| O 2 – C 8 | σ* | 1.991 | C 5 – H 11 | π | 0.031 | 1.62 | 0.78 | 0.032 |
| O 3 – C 9 | σ | 1.992 | N 4 – C 9 | π | 0.074 | 0.77 | 1.42 | 0.03 |
| O 3 – C 9 | σ | 1.992 | N 4 – H 16 | π | 0.021 | 0.99 | 1.36 | 0.033 |
| O 3 – C 9 | σ | 1.992 | C 9 – C 10 | π | 0.054 | 1.13 | 1.34 | 0.035 |
| O 3 – C 9 | σ* | 1.99 | O 3 – C 9 | π* | 0.238 | 1.31 | 0.56 | 0.026 |
| O 3 – C 9 | σ* | 1.99 | N 4 – H 16 | π | 0.021 | 0.85 | 0.86 | 0.024 |
| O 3 – C 9 | σ* | 1.99 | C 10 – H 17 | π | 0.0051 | 0.55 | 0.86 | 0.019 |
| O 3 – C 9 | σ* | 1.99 | C 10 – H 18 | π | 0.0052 | 0.69 | 0.86 | 0.022 |
| N 4 – C 5 | σ | 1.982 | S 1 – C 8 | π | 0.118 | 1.79 | 0.93 | 0.037 |
| N 4 – C 5 | σ | 1.982 | N 4 – C 9 | π | 0.074 | 1.09 | 1.23 | 0.033 |
| N 4 – C 5 | σ | 1.982 | C 5 – C 6 | π | 0.024 | 0.51 | 1.13 | 0.021 |
| N 4 – C 5 | σ | 1.982 | C 6 – C 7 | π | 0.012 | 0.73 | 1.12 | 0.026 |
| N 4 – C 5 | σ | 1.982 | C 9 – C 10 | π | 0.054 | 2.15 | 1.15 | 0.045 |
| N 4 – C 9 | σ | 1.989 | O 3 – C 9 | π | 0.053 | 0.65 | 1.35 | 0.027 |
| N 4 – C 9 | σ | 1.989 | N 4 – C 5 | π | 0.029 | 1.29 | 1.18 | 0.035 |
| N 4 – C 9 | σ | 1.989 | C 5 – C 8 | π | 0.077 | 0.87 | 1.17 | 0.029 |
| N 4 – H 16 | σ | 1.982 | O 3 – C 9 | π | 0.053 | 3.03 | 1.19 | 0.054 |
| N 4 – H 16 | σ | 1.982 | O 3 – C 9 | π* | 0.238 | 2.01 | 0.76 | 0.037 |
| N 4 – H 16 | σ | 1.982 | C 5 – C 6 | π | 0.024 | 1.18 | 1.02 | 0.031 |
| N 4 – H 16 | σ | 1.982 | C 5 – C 8 | π | 0.077 | 0.58 | 1.01 | 0.022 |
| C 5 – C 6 | σ | 1.97 | O 2 – C 8 | π | 0.013 | 2.89 | 1.23 | 0.053 |
| C 5 – C 6 | σ | 1.97 | O 2 – C 8 | π* | 0.233 | 1.26 | 0.62 | 0.026 |
| C 5 – C 6 | σ | 1.97 | N 4 – C 5 | π | 0.029 | 0.53 | 0.98 | 0.02 |
| C 5 – C 6 | σ | 1.97 | N 4 – H 16 | π | 0.021 | 1.41 | 1.03 | 0.034 |
| C 5 – C 6 | σ | 1.97 | C 5 – C 8 | π | 0.077 | 0.57 | 0.97 | 0.021 |
| C 5 – C 6 | σ | 1.97 | C 5 – H 11 | π | 0.031 | 0.56 | 1 | 0.021 |
| C 5 – C 6 | σ | 1.97 | C 6 – C 7 | π | 0.012 | 0.52 | 0.98 | 0.02 |
| C 5 – C 6 | σ | 1.97 | C 6 – H 12 | π | 0.014 | 0.59 | 1.04 | 0.022 |
| C 5 – C 6 | σ | 1.97 | C 7 – H 14 | π | 0.014 | 1.47 | 1.02 | 0.035 |
| C 5 – C 8 | σ | 1.975 | O 2 – C 8 | π | 0.013 | 0.85 | 1.26 | 0.029 |
| C 5 – C 8 | σ | 1.975 | N 4 – C 9 | π | 0.074 | 2.58 | 1.12 | 0.049 |
| C 5 – C 8 | σ | 1.975 | C 5 – C 6 | π | 0.024 | 0.86 | 1.02 | 0.026 |
| C 5 – C 8 | σ | 1.975 | C 6 – H 12 | π | 0.014 | 1.56 | 1.08 | 0.037 |
| C 5 – H 11 | σ | 1.952 | O 2 – C 8 | π | 0.013 | 0.68 | 1.12 | 0.025 |
| C 5 – H 11 | σ | 1.952 | O 2 – C 8 | π* | 0.233 | 6.17 | 0.5 | 0.052 |
| C 5 – H 11 | σ | 1.952 | N 4 – H 16 | π | 0.021 | 1.06 | 0.92 | 0.028 |
| C 5 – H 11 | σ | 1.952 | C 6 – H 13 | π | 0.014 | 2.73 | 0.91 | 0.045 |
| C 6 – C 7 | σ | 1.982 | S 1 – C 8 | π | 0.118 | 0.63 | 0.8 | 0.021 |
| C 6 – C 7 | σ | 1.982 | N 4 – C 5 | π | 0.029 | 3.43 | 0.99 | 0.052 |
| C 6 – C 7 | σ | 1.982 | C 5 – C 6 | π | 0.024 | 0.53 | 1 | 0.021 |
| C 6 – H 12 | σ | 1.973 | S 1 – C 7 | π | 0.02 | 3.63 | 0.64 | 0.043 |
| C 6 – H 12 | σ | 1.973 | C 5 – C 8 | π | 0.077 | 2.21 | 0.85 | 0.039 |
| C 6 – H 13 | σ | 1.979 | N 4 – C 5 | π | 0.029 | 0.55 | 0.86 | 0.019 |
| C 6 – H 13 | σ | 1.979 | C 5 – H 11 | π | 0.031 | 2.59 | 0.88 | 0.043 |
| C 6 – H 13 | σ | 1.979 | C 7 – H 14 | π | 0.014 | 0.52 | 0.91 | 0.019 |
| C 6 – H 13 | σ | 1.979 | C 7 – H 15 | π | 0.022 | 2.45 | 0.9 | 0.042 |
| C 7 – H 14 | σ | 1.986 | C 5 – C 6 | π | 0.024 | 1.9 | 0.9 | 0.037 |
| C 7 – H 15 | σ | 1.987 | C 6 – H 13 | π | 0.014 | 2.39 | 0.93 | 0.042 |
| C 9 – C 10 | σ | 1.983 | O 3 – C 9 | π | 0.053 | 0.78 | 1.17 | 0.027 |
| C 9 – C 10 | σ | 1.983 | N 4 – C 5 | π | 0.029 | 4.04 | 0.99 | 0.057 |
| C 10 – H 17 | σ | 1.976 | O 3 – C 9 | π* | 0.238 | 3.05 | 0.61 | 0.041 |
| C 10 – H 17 | σ | 1.976 | N 4 – C 9 | π | 0.074 | 1.83 | 0.97 | 0.038 |
| C 10 – H 18 | σ | 1.975 | O 3 – C 9 | π* | 0.238 | 3.53 | 0.61 | 0.044 |
| C 10 – H 18 | σ | 1.975 | N 4 – C 9 | π | 0.074 | 1.68 | 0.97 | 0.037 |
| C 10 – H 19 | σ | 1.988 | O 3 – C 9 | π | 0.053 | 4.34 | 1.05 | 0.061 |
| C 10 – H 19 | σ | 1.988 | O 3 – C 9 | π* | 0.238 | 1.15 | 0.62 | 0.025 |
| C 10 – H 19 | σ | 1.988 | N 4 – C 9 | π | 0.074 | 0.52 | 0.98 | 0.021 |
| S 1 | LP ( 1) | 1.985 | C 5 – C 8 | π | 0.077 | 1.86 | 1.01 | 0.039 |
| S 1 | LP ( 1) | 1.985 | C 6 – C 7 | π | 0.012 | 0.65 | 1.02 | 0.023 |
| S 1 | LP ( 2) | 1.766 | O 2 – C 8 | π* | 0.233 | 32.31 | 0.24 | 0.079 |
Table 5: Second order perturbation theory analysis of Fock matrix in NBO basis 3-Acetamidotetrahydro-2-thiophenone.
Electron Localization Function and Localization Orbital ( ELF and LOL)
Electron Localization Function and Localization Orbital are modern tools for analyzing electron density distribution in molecular systems [33]. ELF quantifies degree of electron localization, while LOL describes spatial extent of localized electron clouds. Both ELF and LOL are visualized as color-coded maps in two dimensions.
Figures 6 and 7 depict the ELF and LOL maps of 3-acetamidotetrahydro-2-thiophenone. In ELF map, a deeper blue color indicates a lower electron localization (closer to zero), while red indicates a higher degree of localization (closer to 1.0). In LOL map, blue represents regions of high electron depletion, while red indicates regions of low electron depletion. Analysis of ELF map reveals that hydrogen atoms (H12, H16) in 3-acetamidotetrahydro-2-thiophenone are located in regions of high electron localization (red areas) and Carbon atoms(C6, C7) are in blue region. In LOL map, blue represents regions of high electron depletion, while red indicates regions of low electron depletion. Carbon atoms (C6, C7) are found in blue regions [34].
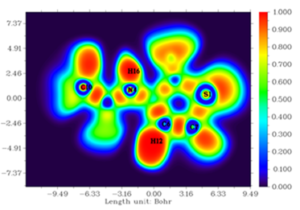
Figure 6: ELF colour-filled map of 3-Acetamidotetrahydro-2-thiophenone.
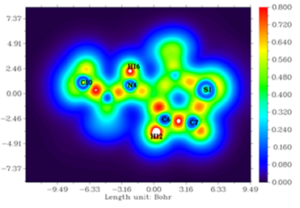
Figure 7: LOL map of 3-Acetamidotetrahydro-2-thiophenone.
Biological Evaluation
Pharmacological studies
Drug-like properties of 3-acetamidotetrahydro-2-thiophenone were evaluated using SwissADME, an online software tool. Adherence to Lipinski’s rule is a crucial criterion for selecting potential drug candidates [35]. As shown in Table 6, the compound satisfies all of Lipinski’s rules, with an HBD count of 1, an HBA count of 2 (within the preferred range), 3 rotatable bonds (out of a maximum of 10), and a molecular weight of 159.21 g/mol. Calculated drug-likeness parameters fall within the accepted ranges, suggesting that 3-acetamidotetrahydro-2-thiophenone possesses favorable characteristics for drug development [36,37].
| Descriptor | value |
| Hydrogen Bond donors | 1 |
| Hydrogen Bond acceptors | 2 |
| MlogP | -0.51 |
| GI absorption | high |
| Lipinski violation | 0 |
| skin permeation | -7.52 |
| molar refractivity | 39.63 |
| Bioavailability score | 0.55 |
| Number of rotatable bonds | 3 |
| Molecular weight | 159.21 g/mol |
| BBB permeant | No |
Table 6: Drug likeness parameters for 3-acetamido tetrahydro-2-thiophenone compound.
In vitro cytotoxicity activity
3-acetamidotetrahydro-2-thiophenone was tested against the Human Lung Carcinoma (A549) cell line by subjecting the cells to several doses, ranging from 1000µg/mL to 7.8µg/mL. MTT assay was used to measure the metabolic activity using a colorimetric determination to examine the cytotoxic effect of specific doses of the title chemical on the Human Lung Carcinoma (A549) cell line. Since MTT assay is used to identify cells with consistent mitochondrial activity, changes in the number of viable cells are directly correlated with changes in mitochondrial activity. [38]. In the present study, percentage cell viability is given in Table 7 and it was found with 69.62 ± 2.55% cell viability at higher concentration (500µg/mL) on Human Lung Carcinoma (A549) cell line. CTC50 value obtained from MTT assay for the title compound on Human Lung Carcinoma (A549) cells was found to be 855.496 µg/mL. On decreasing concentration, cell viability was found to be increased.
| Concentration (µg/mL) | Percentage of cells viable after treatment | |
| 1000 | 47.71 ± 4.50 | |
| 500 | 69.62 ± 2.55 | |
| 3-acetamido tetrahydro-2-thiophenone | 250 | 74.53 ± 3.94 |
| 125 | 79.11 ± 3.70 | |
| 62.5 | 84.92 ± 2.03 | |
| 31.25 | 90.03 ± 2.13 | |
| 15.628 | 94.64 ± 1.26 | |
| 7.8 | 98.32 ± 0.45 |
Table 7: Analysis of the in vitro cytotoxicity of 3-acetamido tetrahydro-2-thiophenone against Human Lung Carcinoma (A549) cell line by MTT assay
Ramachandran plot and Molecular docking studies
Ramachandran plots were employed to validate protein structures and assess their binding affinities. Two proteins with anti-emphysema properties, 3NE4 and 3CWL, were selected for docking studies. Ramachandran plots (RC) plots were generated using Discovery Studio software and are depicted in Figures 8 (a) and 8 (b). Only a small number of residues are located in the restricted region. RC plots reveal that majority of amino acid residues in both proteins reside within permitted region of the Ramachandran plot, indicating a stable protein conformation [39,40].
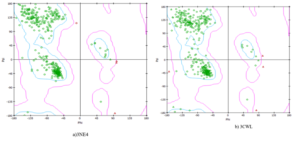
Figure 8: Ramachandran plot of proteins.
Molecular docking is a powerful computational technique used to investigate drug-protein interactions [41]. Molecular docking is employed to evaluate the potential therapeutic efficacy of 3-acetamidotetrahydro-2-thiophenone on emphysema. Title compound was docked against the 3NE4 [42] and 3CWL [43] proteins using AutoDock Tools 1.5.6, and resulting ligand-protein interactions were visualized using Discovery Studio. Table 8 summarizes docking results, including binding energies for 3NE4 (-5.14 kcal/mol) and 3CWL (-5.37 kcal/mol). Two-dimensional and three-dimensional representations of ligand-protein interactions are depicted in Figure 9. Glycopyrrolate and Tiotropium bromide are commercially available drugs in treating emphysema and have binding energy -6kcal/mol and -5.7kcal/mol respectively [44]. These findings suggest, 3-acetamidotetrahydro-2-thiophenone exhibits strong anti-emphysema properties [45,46].
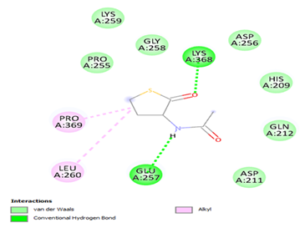
a) 2D docking diagram of 3NE4 and 3-Acetamidotetrahydro-2-thiophenone.
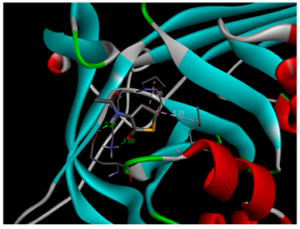
b) 3D molecular docking diagram
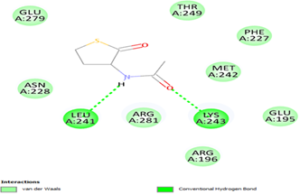
c) 2D docking diagram of 3CWL and 3-Acetamidotetrahydro-2-thiophenone.
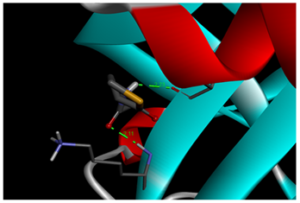
d) 3D molecular docking diagram
Figure 9: 2D and 3D docking diagrams.
Table 8: Molecular docking of 3-acetamidotetrahydro-2-thiophenone.
Conclusion
3-Acetamidotetrahydro-2-thiophenone was subjected to a comprehensive investigation that includes molecular geometry, spectroscopic characterization (FT-IR, FT-Raman), electronic structure analysis ( MEP, FMO), Nonlinear Optical Properties (NLO), and biological evaluation. Compound’s molecular geometry, vibrational spectra, and electronic transitions were thoroughly explored using both theoretical and experimental approaches. Mapping of molecular electrostatic potential (MEP) provided insights into reactive sites, while frontier molecular orbital (FMO) analysis assessed the compound’s stability and reactivity. Additionally, nonlinear optical properties were evaluated, and compound’s potential as a drug candidate was assessed using drug likeness criteria. In vitro cytotoxicity assays predicted the cell viability of title compound. To explore compound’s potential therapeutic applications, molecular docking studies were conducted with proteins associated with emphysema (3NE4 and 3CWL). Binding energies and Ramachandran plots revealed favorable interactions and stability. Binding energy of commercially available drugs (Glycopyrrolate and Tiotropium bromide) was comparable with title compound. Results predict that 3-Acetamidotetrahydro-2-thiophenone could be a promising therapeutic option for the treatment of emphysema.
Disclosure of Interest: The authors report there are no competing interests to declare.
Credit authorship contribution statement
Dona Benny: Validation, Visualization, Writing-original draft, Writing-review and editing.
Johanan Christian Prasana: Validation, Supervision, Resources, Methodology and Software.
References
- Chaudhary A Jha KK, Kumar S (2012) Biological diversity of thiophene: a review. Journal of Advanced Scientific Research, 3(03), pp.3-10.
- Shah R, Verma PK (2018) Therapeutic importance of synthetic thiophene. Chemistry Central Journal,12, pp.137.
- Chen Z, Ku TC, Seley-Radtke KL (2015) Thiophene-expanded guanosine analogues of gemcitabine. Bioorganic & medicinal chemistry letters, 25(19), pp.4274-4276.
- Russell RK, Press JB, Rampulla RA, McNally JJ, Falotico R, Keiser JA, Bright DA, Tobia A (1988) Thiophene systems. 9. Thienopyrimidinedione derivatives as potential antihypertensive agents. Journal of medicinal chemistry, 31(9), pp.1786-1793.
- Pillai AD, Rathod PD, Xavier FP, Padh H, Sudarsanam V, Vasu KK (2005) Tetra substituted thiophenes as anti-inflammatory agents: exploitation of analogue-based drug design. Bioorganic & medicinal chemistry, 13(24), pp.6685-6692.
- Tehranchian S, Akbarzadeh T, Fazeli MR, Jamalifar H, Shafiee A, (2005) Synthesis and antibacterial activity of 1-[1, 2, 4-triazol-3-yl] and 1-[1, 3, 4-thiadiazol-2-yl]-3-methylthio-6, 7-dihydrobenzo [c] thiophen-4 (5H) ones. Bioorganic & Medicinal Chemistry Letters, 15(4), pp.1023-1025.
- Woodward RB, Eastman RH (1946) Tetrahydrothiophene (“thiophane”) derivatives. Journal of the American Chemical Society, 68(11), pp.2229-2235.
- Pathania S, Narang RK, Rawal RK (2019) Role of sulphur-heterocycles in medicinal chemistry: An update. European journal of medicinal chemistry,180, pp.486-508.
- Frisch MJ, Trucks GW, Schlegel HB, Scuseria GE, Robb MA, et al. (2016) Gaussian16 Revision A. 03 (Wallingford, CT: Gaussian Inc.).
- Dennington, Roy, Todd Keith, John Millam, Semichem Inc, Shawnee Mission KS, (2009) GaussView, Version 5.
- Jamróz MH, Vibrational Energy Distribution Analysis; VEDA 4 Program, Warsaw, Poland, 2004–2010.
- Lu T, Chen F (2012) Multiwfn: A multifunctional wavefunction analyzer. Journal of computational chemistry, 33(5), pp.580-592.
- Filimonov DA, Lagunin AA, Gloriozova TA, Rudik AV, Druzhilovskii DS, et al. (2014) Prediction of the biological activity spectra of organic compounds using the PASS online web resource. Chemistry of Heterocyclic Compounds, 50, pp.444-457.
- The PyMOL Molecular Graphics Development Component, Version 1.8, PYMOL Mol. Graph. Dev. Component,Version 1.8, Schrodinger LLC.
- Dassault Systemes BIOVIA: Discovery Studio Visualizer 21.1.0.20298, 2020.
- Priscilla J, Dhas DA, Joe IH, Balachandran S, (2020) Experimental and theoretical spectroscopic analysis, hydrogen bonding, reduced density gradient and antibacterial activity study on 2-Phenyl quinoline alkaloid. Chemical Physics, 536, p.110827.
- Benny D, Prasana JC, Thirunavukkarasu M, Khaled JM, Muthu S, (2024) In vitro cytotoxicity activity (MTT assay), Experimental spectral investigations, Quantum Computational, Solvents performance, and biological evaluation on N-tert-Butoxycarbonylimidazole. Journal of the Indian Chemical Society, p.101366.
- Anju LS, Aruldhas D, Joe IH, John NL (2020) Spectroscopic, quantum mechanical and docking studies on organochlorine insecticides by density functional theory. Journal of Molecular Structure, 1208, p.127904.
- Colthup NB, Daly LH, Wiberley SE (1990) AMINES, C= N, AND N= O COMPOUNDS. Introduction to infrared and Raman spectroscopy, pp.339-354.
- Tanak H, Marchewka MK (2013) FT-IR, FT-Raman, and DFT computational studies of melaminium nitrate molecular–ionic crystal. Journal of Molecular Structure, 1034, pp.363-373.
- Edwin B, Joe IH (2013) Vibrational spectral analysis of anti-neurodegenerative drug Levodopa: A DFT study. Journal of Molecular Structure, 1034, pp.119-127.
- Udhayakala P, Rajendiran TV, Seshadri S, Gunasekaran S (2011) Quantum chemical vibrational study, molecular property and HOMO-LUMO energies of 3-bromoacetophenone for Pharmaceutical application. Chem. Pharm. Res, 3(3), pp.610-625.
- Amalanathan M, Suresh DM, Joe IH, Jothy VB, Sebastian S, Ayyapan S (2016) FT-IR and FT-Raman spectral investigation and DFT computations of pharmaceutical important molecule: ethyl 2-(4-Benzoyl-2, 5-dimethylphenoxy) acetate. Pharm Anal Acta, 7(457), pp.26-28.
- Satheeshkumar K, Kumar PS, Shanmugapriya R, Nandhini C, Vennila KN, Elango KP (2023) Ratiometric fluorescence sensing of hypochlorite ion by dansyl hydrazine-Spectroscopic and TD-DFT studies. Journal of Molecular Structure, 1275, p.134719.
- Kumer A, Sarker MN, Paul S (2019) The simulating study of HOMO, LUMO, thermo physical and quantitative structure of activity relationship (QSAR) of some anticancer active ionic liquids. Eurasian Journal of Environmental Research, 3(1), pp.1-10.
- Çalışkan ŞG, Genç O, Erol F, Sarıkavaklı N (2022) Molecular Docking, HOMO-LUMO, Quantum Chemical Computation and Bioactivity Analysis of vic-Dioxim Derivatives Bearing Hydrazone Group Ligand and Their NiII and CuII Complexes. Gazi University Journal of Science Part A: Engineering and Innovation, 9(3), pp.299-313.
- Gadre SR, Kulkarni SA, Shrivastava IH (1992) Molecular electrostatic potentials: A topographical study. The Journal of chemical physics, 96(7), pp.5253-5260.
- Murray JS, Sen K, eds., (1996) Molecular electrostatic potentials: concepts and applications.
- Pallen S, Shetty Y, Das S, et al. (2021) Advances in nonlinear optical microscopy
techniques for in vivo and in vitro neuroimaging, Rev. 13:
1199–1217. - Zhang S, Liu L, Ren S, Li Z, Zhao Y, et al. (2020) Recent advances in nonlinear optics for bio-imaging applications, Opto-Electron. Adv. 3: 200003.
- Gangadharan R, Sampath Krishnan S (2014) Natural Bond Orbital (NBO) population analysis of 1-azanapthalene-8-ol. Acta Physica Polonica A, 125(1), pp.18-22.
- Snehalatha M, Ravikumar C, Joe IH, Sekar N, Jayakumar VS (2009) Spectroscopic analysis and DFT calculations of a food additive Carmoisine. Spectrochimica Acta Part A: Molecular and Biomolecular Spectroscopy, 72(3), pp.654-662.
- Arulaabaranam K, Muthu S, Mani G, Geoffrey AB. Speculative assessment, molecular composition. PDOS, topology exploration (ELF, LOL, RDG), ligand-protein interactions, on.
- Tarika JD, Dexlin XD, Madhankumar S, Jayanthi DD, Beaula TJ (2021) Tuning the computational evaluation of spectroscopic, ELF, LOL, NCI analysis and molecular docking of novel antiCOVID-19 molecule 4-dimethylamino pyridinium 3, 5-dichlorosalicylate. Spectrochimica Acta Part A: Molecular and Biomolecular Spectroscopy, 259, p.119907.
- Mumit MA, Pal TK, Alam MA, Islam MAAAA, Paul S, Sheikh MC (2020) DFT studies on vibrational and electronic spectra, HOMO–LUMO, MEP, HOMA, NBO and molecular docking analysis of benzyl-3-N-(2, 4, 5-trimethoxyphenylmethylene) hydrazinecarbodithioate. Journal of molecular structure, 1220, p.128715.
- Tian S, Wang J, Li Y, Li D, Xu L, Hou T (2015) The application of in silico drug-likeness predictions in pharmaceutical research. Advanced drug delivery reviews, 86, pp.2-10.
- Lipinski CA, (2004) Lead-and drug-like compounds: the rule-of-five revolution. Drug discovery today: Technologies, 1(4), pp.337-341.
- Denizot F, Lang R (1986) Rapid colorimetric assay for cell growth and survival: modifications to the tetrazolium dye procedure giving improved sensitivity and reliability. Journal of immunological methods, 89(2), pp.271-277.
- Benny D, Prasana JC, Khaled JM, Abbas G, Muthu S (2023) Experimental, computational investigations and biological evaluation on 1-(3-acetamidophenyl)-5-mercaptotetrazole-cytotoxicity MTT assay. Journal of Molecular Liquids, 389, p.122903.
- Bathula R, Muddagoni N, Lanka G, Dasari M, Potlapally S (2021) Glide docking, autodock, binding free energy and drug-likeness studies for prediction of potential inhibitors of cyclin-dependent kinase 14 protein in wnt signaling pathway. Biointerface Res Appl Chem, 12(2), pp.2473-2488.
- Kumar M, Ahmad S, Garima K, Ali A, Arora H, Muthu S, Saral A, Kumar A, Afzal M, Javed S (2023) Molecular docking and dynamic simulations of 2-phenoxyaniline and quantum computational, spectroscopic, DFT/TDDFT investigation of electronic states in various solvents. Chemical Physics Impact, 7, p.100307.
- Angstrom structure of intact native wild-type alpha-1-antitrypsin.
- Crystal structure of alpha-1-antitrypsin, crystal form B.
- Wong B, Datla SSP, Li C, Joyce C, Alzagatiti J, Developing anticholinergic drugs for the treatment of asthma with improved efficacy.
- Gopi B, Vijayakumar V (2024) Synthesis and molecular docking of novel indazole derivatives with DFT studies.
- Hamzah HA, Afladhanti PM, Romadhan MD, Agustini D, Deanasa RS (2022) Molecular Docking of Mangrove Plant as Therapeutic Agent to Treat Non-Small Cell Lung Carcinoma. Journal of Pharmaceutical Research International, 34(46A), pp.30-39.