

Validity of multiple-choice questions for the assessment of medical post graduate students- a retrospective observational study Mohit Dhingra, Aditya KS Gowda*, Vikas Maheshwari, Pankaj Kandwal, Roop Bhushan Kalia, Vivek Singh, Pradeep Kumar Meena, Sajid Ansari
Department of Orthopaedics, All India Institute of Medical Sciences, Rishikesh, India
*Correspondence to: Aditya KS Gowda
Citation: Dhingra M, Gowda AKS, Maheshwari V, Kandwal P, Kalia RB, et al. (2023) Validity of multiple-choice questions for the assessment of medical post graduate students- a retrospective observational study. Sci Academique 4(1): 34-42
Received: 27 April, 2023; Accepted: 16 May 2023; Publication: 26 May 2023
Abstract
Objectives: This study is designed to validate the multiple-choice questions for the assessment of post graduate students in order to improve their quality as well as distractors used for assessment.
Methods: It is a retrospective observational study carried out in department of Orthopaedics from July 2018 to June 2021 given to the 10 post graduate students. A total of 17 modules of 50 questions each were given every alternate month. The assessment of these questions was then done by difficulty index (DIF) and discriminatory index (DI) and the reliability of the test was assessed by estimating the Kuder-Richardson 20 coefficient (KR20).
Results: The score ranged from 413 to 486 with mean of 443.7 ± 24.31. The mean DIF (%) and DI was 54.88±16.03% and 0.146 ± 0.379%. Majority of the items, 800 (94.12%) had acceptable level of difficulty while 401 items (47.17%) among them had excellent DI. A good majority of items 434 (51.29%) had good to excellent discrimination indices (DI ≥0.3), with 238 (28%) had marginal impacting DI and 178 (20.94%) items had poor DI. A combination of the two indices revealed that 434 (51.05%) items could be called ‘ideal’. Among these there were 140 (16.47%) items as excellent and 294 (35.58%) items as good. The reliability of our test was 0.99 suggesting highly reliability.
Conclusion: Item analysis is a precious tool in detecting and scrutinizing the quality of MCQs and could help identifying poorly constructed items and optimize them to improve the quality.
Keywords: Multiple choice questions, Test reliability, Difficulty index, Discriminatory index
Introduction
Multiple-choice questions (MCQs) are commonly used test pattern in various domains of applied sciences today. This pattern of examination with time has proven to be sophisticated, yet a modest measure of students’ knowledge especially useful in measuring the medical aptitude. An MCQ entails a question, followed by several options. Out of these, one is the best response also known as the key, while the others are named as distractors [1,2]. These distractor options shall present as conceivable answers and if possible, none shall be incorrect. The purpose of a distractor is to draw attention of students who do not know the right answer while students who know it ignore them [1,3].
These clinical vignettes whether in the format of “one- best answer” or “true/false” or “multiple correct answers” type, are designed to assess knowledge. Carefully constructed MCQs (especially one-best-answer-type) may test higher-order thinking skills of individual and are not based on mere factual recall [4]. They have the advantage of enhancing knowledge on the topic efficiently and therefore urges the candidate to prepare a particular topic on grounds of assertion reasoning, and not just mugging up information.
With the introduction of the New Integrated Curriculum (NIC), short-answer-type questions (SAQ) pattern have taken over long essays, while short-answer, true/false-type MCQs or “spot-test” practical examination, now known as objective structured practical examination (OSPE), remain [5]. With this, examination papers are now multidisciplinary, with integration across multiple domains and scenario oriented. Moreover, a well-constructed multiple-choice item can bring out higher cognitive skills of Bloom’s taxonomy such as application, aptitude, knowledge, analysis, and practice [5].
In order to provide quality MCQ to the competing students the assessment need to be done by the process which is broadly termed as item analysis. These parameters not only judge the difficulty index of the stem made but also helps to define the quality of distractors used for the objective assessment [6,7]. It allows ways of re-using items repeatedly in different instruments with prior knowledge of how exactly they will perform. It also directs the examiner to relook to the questions and its distractors designed and thus improving the quality of the stem made.
The difficulty of a single response is measured as the proportion of people who responded the questions correctly [8]. Discriminatory index defines the quality of the distractors used and is able to tell whether the answer given by the students is by knowledge or by fluke [2].
Conclusions have been reached based on the performance of the individuals and groups assessed by testing higher-order cognitive abilities through the scoring, reviewing, and reporting of the results. Since well-designed clinical vignettes are considered to be highly efficient in medical knowledge evaluation. So, we conducted a single centre cohort study in our university level teaching institute to validate the MCQs to assess the progress of post graduate students on bimonthly intervals on the modules prepared for the whole 3 years in department of orthopaedics from January 2018 to December 2020.
Materials And Methods
Study Settings
The study was conducted by the Department of Orthopaedics, AIIMS Rishikesh, India. The clinical vignettes were prepared by the faculties with expertise in various subspeciality in the subject of orthopaedics.
Each test comprising of fifty clinical vignettes was administered to ten Post graduate students of the department at two months interval during their tenure of the course of 3years. The time allotted was 60 minutes. A total of 17 modules were given in all. So total of 850 MCQs were analysed in this study. The items were having a single stem with one key being correct and the other three being ‘distractors’ [2]. The examinee were required darken the correct choice on an optical mark reader (OMR) sheet. Each OMR sheet was analysed by optical computer scanner. Each correct response was rewarded 1 mark and each incorrect/unanswered response was rewarded 0, range of total score being 0-50 marks.
Statistical Analysis
Each of the selected papers were validated using item statistics. Individual scores of 10 students in 17 papers were entered in order of merit explicitly in MS Excel 2010 and calculations based on mean, standard deviations, simple proportions, correlation were calculated using the tools in excel software. After evaluation, data obtained was scrutinized according to their difficulty index (p value), discrimination index (DI) and further actions such as discard/ review were proposed. Reliability of the test was assessed by estimating the Kuder-Richardson 20 coefficient (KR20) and it depends upon how well it is constructed.
Item statistics
Difficulty Index (DIF) or Facility value
It is the p-value that expresses the proportion of examinee who answered the item correctly. The formula used to calculate DIF is
p =c /n
where, c is the number of students who selected the correct choice and n is the total number of postgraduates participated.
The DIF p (proportion) value ranges from 0 to 1 and it can be expressed in percentage of students who opted for the item correct. DIF being interpreted as the easier the question, higher is the p value and percentage. In general, p value across 20 – 80% are in the good and acceptable terms. Items with Difficulty Index between 40-60% are considered on par excellent, as discrimination index is maximum at this range. Items with value less than 20% (too difficult) and above 80% (too easy) are not satisfactory and need necessary changes [2,9,10].
Discrimination Index
The discrimination index (DI) is defined as the value of a question in segregating effectively between high and low scorers. The postgraduates are divided into three groups based on the scores in these tests as a whole. An upper group of 3(28%) post graduates (PGs), middle order of 4 PGs (44%) and lower group consisting of 3 PGs (28%) according to their scores [2]. Discrimination index in our analysis was estimated using the following formula:
DI = PU-PL
where, PU are the proportions of the students in the upper and PL is the low group who got the resultant item correct.
The Item discrimination index falls between -1.00 to 1.00. When DI is 1.00, all the higher scorers answered the item in favour and all the lower scorer answered the item incorrectly. Conversely, the DI value would be -1.00 if none of the upper group students answered it correctly. Higher the value of DI, better is the quality of question and the DI value 0.40 and greater are considered excellent items and may be stored. Furthermore, items with DI 0.30 to 0.39 is reasonably good with a possibility of subject to improvement and revision, those with DI 0.20 to 0.29 are termed as marginal items and which needs to be reviewed meticulously while those with DI below 0.19 are termed as poor items which needs elimination [2,11].
In our study we have slightly modified the above-described categorisation followed by previous papers. This can be mainly attributed to the fact that we considered 10 students but 850 items. The results couldn’t segregate population falling into marginal (0.2 to 0.29) zone. Therefore, we considered marginal zone to be starting from 0 to 0.29 in the current study.
Test Reliability
Internal reliability of the test was scaled by Kuder-Richardson 20 (KR20) coefficient and any defective item noted by item analysis needs to be looked for item writing flaws and must be optimized. In order to calculate reliability formula for KR20 for a test with K test items numbered i=1 to K used was
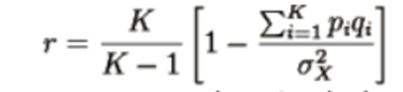
where, Pi is the proportion of correct responses and Qi is the proportion of incorrect responses to test item i (so that Pi + Qi =1), and the variance for the denominator is calculated as
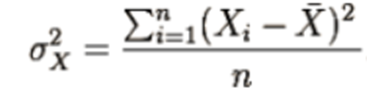
where, n is the total sample size, Xi is the score of individual students and is the mean total score. The value of KR20 ranges from 0 to 1, with numbers closer to 1 reflecting greater internal consistency indicating that the items are all measuring the same thing or general construct. The widely-accepted cut-off value of KR is greater than or equal to 0.7 and a well-constructed item [2,12].
The mean corresponds to the “average” student response to an question computed by adding up the number of points earned by all students on the item, and dividing that total by the number of students. The standard deviation, or S.D., is a measure of the dispersion of student scores on that question. These statistical parameters are more meaningful when comparing items which have more than one correct alternative and when scale scoring is used.
Results We assessed in total 850 MCQs and 2,550 distractors. Scores of 10 students ranged from 413 to 486 (out of 850), while the mean score was 443.7 ± 24.31. Mean scores for each group were: lower 427.66 ± 4.16; middle 442.5 ± 8.96; upper 471.33 ± 18.9. DIF p-value (%) and DI averaged 54.88 ± 16.03% and 0.146 ± 0.379%, respectively.
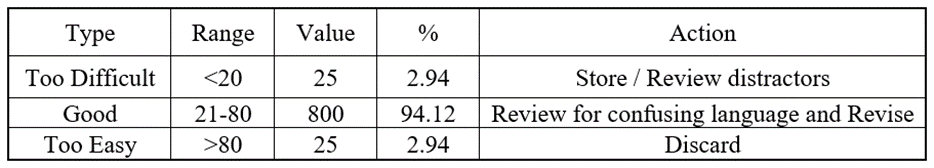
Table 1: Distribution of difficulty indices of the items.
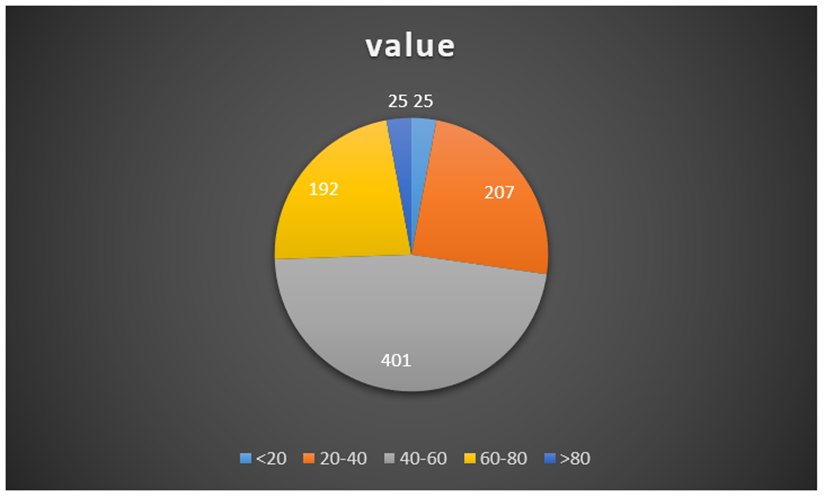
Figure 1: Schematic representation of distribution of DIF.
In Table 1, we show the distribution of discrimination and difficulty indices of the MCQs and thereby inferring whether it is well-constructed or not. The majority of the items 800 (94.12%) had acceptable difficulty with p-value within the range of 20% to 80% although 401 items (47.17%) among them had excellent p-value (40-60%). Twenty-five items (2.94%) were deemed too difficult (p-value <20%) and twenty-five items (2.94 %) were deemed too easy (p-value>80%) (figure 1). Likewise, a good bulk of items 434 (51.29%) had good to excellent discrimination indices (DI ≥0.3), with 238 (28%) having marginally impacting DI and 178 (20.94%) items have a poor DI (table 2).
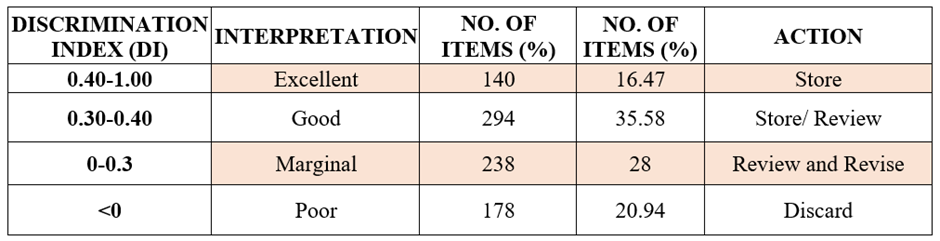
Table 2: Distribution of Discriminatory indices of the items.
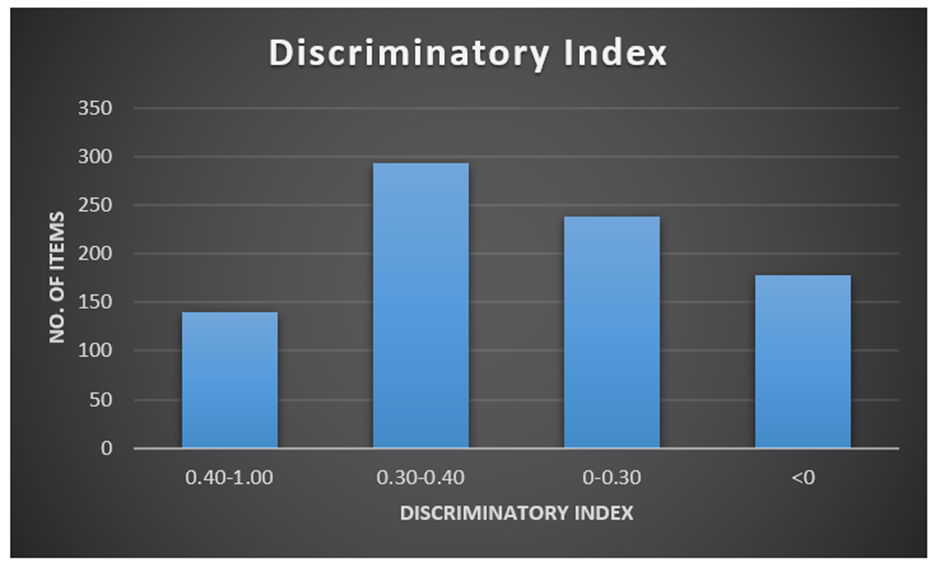
Figure 2: Schematic representation of distribution of DI.
In combination, 434 (51.05%) items could be described as ‘ideal’: they had a p-value of 20 to 80%, and a DI ≥ 0.3 (figure 2). However, on considering excellent p-value (40-60%) and excellent DI (≥0.4), 140 (16.47%) items were excellent and 294 (35.58%) items were good, respectively.
Our test’s reliability was 0.99 with N = 10 and K = 850, indicating that this was a highly reliable test with excellent internal consistency.
Correlation between the DI and DIF is shown in Figure 3. Firstly, as p increases, so does DI, and DI reaches a maximum at a p-value between 40% and 60%. DI decreases proportionally when p exceeds 60%. Ranging 40% – 60%, the DI values appear to have a maximum density of the parameters compared to the other ranges.
Discussion
Single correct response MCQs are effective tools for evaluating the knowledge of students. Correct feedback to the experts is necessary for improving the quality of these MCQs. The assumption on part of the expert that the questions prepared by them are standard needs to be evaluated. Item analysis is a standard way of evaluation of these questions and give necessary feedback 8. Tests of reliability, DIF, and DI are among the tools that determine whether MCQs have been well constructed or not. Analyzing item data serves as one such method of analyzing observation and interpretation of the knowledge gained by the students [2].
The mean p-value of this study was 54.88±16.03 %, which is close to an excellent level of difficulty (p=40 to 60 %), or 47.97%. Our findings were corroborative with that of Bhat et al and kheyami et al who both reported mean p-value of 53% [7,13]. However, studies by Gajjar S (48%) and Shenoy PJ (40%) have reported lower mean p-values [14,15]. Also there have been quotes in the literature by where the DIF% mean p-value was higher such as in both Mukherjee and Mehta (62%) [2,16].
A reasonably good DI was found in this study, 0.146±0.379. Nonetheless, a substantial proportion of items (43.05%) had poor DI. Study by Mukherjee et al. reported mean of DI of 0.31 ± 0.27. Items with DI > 0.3 were 66.58%, DI and DI <0.2 were 33.41% [2]. Similar statistics were reported by Mehta et al (DI=0.33) [16].
While it is also to be noted that studies have interpreted their results in the form of items having good DI. For example, Shenoy et al described DI of 12 excellent (20%) (d value >0.35), 36 good (60%) and 12 poor (20%) items [15]. While our study concluded Excellent in 140 (16.5%) (d value >0.4), good in 294 (35.6%) (d value 0.3-0.4), marginal in 238 (28%) (d value 0 to 0.3) and poor in 178 (20.9%) (d value <0). The difference may be due to a smaller number of students in our study (ten) and the humongous data of 850 questions per student in comparison to the other studies.
Except for extreme cases in which the DIF is either too high or too low, DI and DIF are inversely related. Their relationship is not linear, but dome-shaped [5]. The higher the DIF (easier questions), the worse the discrimination, whereas the lower the DIF (difficult questions) the better the discrimination, unless they are so difficult that good students cannot attempt them correctly. [17,18]. With both indices combined, 434 (51.05%) items were deemed ‘ideal’ with p-values ranging from 20 to 80% and a DI ≥ 0.3. On the other hand, if only the excellent p-values (40-60%) and excellent DIs (≥0.4) were considered, there were 140 (16.47%) excellent items and 294 (35.58%) good items. According to Mukherjee et al. 14 items (46.67 %) were ‘ideal’, having both a good p-value (20 to 90%), and DI> 0.24 [2].
We had reliability of 0.99 indicating that this was a highly reliable test with excellent internal consistency. Mukherjee et al. found the reliability of their test was 0.9. To the best of our search the data pertaining to reliability of the tests shows limited research, but studies found that values ≥0.70 are acceptable [2].
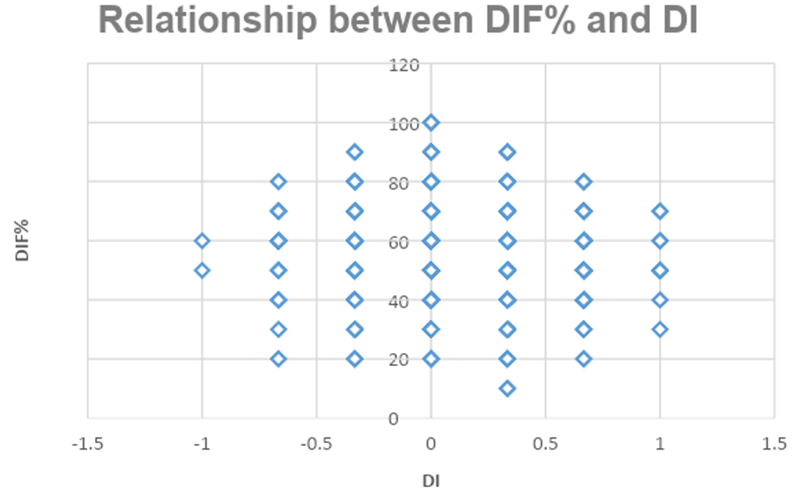
Figure 3: Relationship between difficulty index and discrimination index.
As shown in Figure 3, DI correlates poorly with DIF. They share a dome shaped relationship, rather than linear. First, as DIF increases, the DI increases hyperbolically, but at a p-value between 40% and 60%, DI reaches a maximum [8,11]. Over the range 40% – 60%, the DI is more than 0.5 and DI falls at p>60%.
There were limitations in our study. A larger sample size would have been an advantage and a similar study on a larger number may be more conclusive, although we believe that the number of postgraduates in a department may be limited elsewhere too. There were many questions in our study with poor DI which was different from many previous studies. Including more MCQs may give a consistent result and need further study.
Conclusion
Items with acceptable DI and DIF will be generated for examinations using the item analysis. Items analysed in our study had optimum difficulty level and fair discriminatory indices. While the overall DI was good, a substantial portion of items had poor DI. Maximum discrimination was found at p-value range between 40% and 60%. Periodical MCQ analysis is required for validation of existing question bank in subjects, which are mainly useful in clinical branches like Orthopaedics. Faculty development programs are also required to standardize the MCQs for effective evaluation of the students.
Limitations
The study had limitation of number of students who appeared for the modules which resulted in low discriminatory index depicted in comparison to the studies done already. Also the power of the study is very small to generalise the outcome.
Declarations
Conflict of interest: The authors of this article declare that there is no conflict of interest for the present study
Funding: No funding of any kind was taken for carrying out this study
References
- MCQs – Designing Multiple Choice Questions This resource page was compiled for the Faculty of Engineering, Architecture and Science. For more teaching | Course Hero.
- P. Mukherjee and S. Lahiri (2015) “Analysis of Multiple Choice Questions ( MCQs ) : Item and Test Statistics from an assessment in a medical college of Kolkata , West Bengal.
- Assessment: Characteristics of Good Multiple-Choice Questions.
- D. S. Christian, A. C. Prajapati, B. M. Rana, and V. R. Dave (2017) “Evaluation of multiple choice questions using item analysis tool: a study from a medical institute of Ahmedabad, Gujarat,” Int. J. Community Med. Public Health, vol. 4, no. 6, pp. 1876–1881.
- Si-Mui Sim 1, Raja Isaiah Rasiah (2006) Relationship between item difficulty and discrimination indices in true/false-type multiple choice questions of a para-clinical multidisciplinary paper. Ann Acad Med Singap 35: 67-71.
- S. Biswas, dr vaishali Jain, V. Agrawal, and M. Bindra (2015) Small group learning: Effect on item analysis and accuracy of self-assessment of medical students,” Educ. Health Abingdon Engl. 28: 16–21.
- D. Kheyami, A. Jaradat, T. Al-Shibani, and F. A. Ali (2018) Item Analysis of Multiple Choice Questions at the Department of Paediatrics, Arabian Gulf University, Manama, Bahrain,” Sultan Qaboos Univ. Med. J., vol. 18, no. 1, pp. e68–e74.
- J. Chhaya, H. Bhabhor, J. Devalia, U. Machhar, and A. Kavishvar (2018) A Study on Quality check on Multiple Choice Questions (MCQs) Using Item Analysis for Differentiating Good and Poor Performing Students,” vol. 9, no. 1, p. 6.
- C. Boopathiraj, K. Dr, and Chellamani (2013) Analysis of Test Items on Difficulty Level and Discrimination.
- R. Ebel and D. Frisbie, “ESSENTIAOLFS EDUCATIONAL MEASUREMENT,” p. 383.
- Kuder and Richardson Formula 20 | Real Statistics Using Excel: 2022.
- S. K. Bhat and K. H. L. Prasad (2021) Item analysis and optimizing multiple-choice questions for a viable question bank in ophthalmology: A cross-sectional study. Indian J. Ophthalmol., vol. 69, no. 2, pp. 343–346.
- Item and test analysis to identify quality multiple choice questions (MCQS) from an assessment of medical students of Ahmedabad, Gujarat Gajjar S, Sharma R, Kumar P, Rana M – Indian J Community Med: 2022.
- P. J. Shenoy, V. Sayeli, and R. R. Rao (2016) Item-analysis of multiple choice questions: A pilot attempt to analyze formative assessment in pharmacology. Res. J. Pharm. Biol. Chem. Sci., vol. 7, no. 2, pp. 1683–1687.
- G. Mehta and V. Mokhasi (2014) Item Analysis of Multiple Choice Questions- An Assessment of the Assessment Tool. Int. J. Health Sci 7: 6.
- B. N. Karelia and A. Pillai (2013) The levels of difficulty and discrimination indices and relationship between them in four-response type multiple choice questions of pharmacology summative tests of Year II M.B.B.S students.
- R. Garg, V. Kumar, and J. Maria (2018) Analysis of multiple choice questions from a formative assessment of medical students of a medical college in Delhi, India. Int. J. Res. Med. Sci 7: 174–177.