

Association and path analyses among morpho-agronomic traits, fatty acids contents and oil yield in linseed (Linumussitatisimum L.) genotypes in Ethiopia Tadesse Ghiday1*, Wassu Mohamed2, Yemane Tsehaye3, Adugna Wakjira1, Chemeda Daba4, Tesfaye Dissasa1
1Ethiopian Institute of Agricultural Research, Holeta Agricultural Research Center
2Haramaya University
3Mekele University
4Oromia Institute of Agricultural Research, Addis Ababa
*Correspondence to: Tadesse Ghiday
Citation: Ghiday T, Mohamed W, Tsehaye Y, Wakjira A, Daba C, et al. (2024) Association and path analyses among morpho-agronomic traits, fatty acids contents and oil yield in linseed (Linumussitatisimum L.) genotypes in Ethiopia. Sci Academique 5(1): 9-28.
Received: 25 January, 2024; Accepted: 15 March, 2024; Publication: 21 March, 2024
Abstract
The improvement for a trait of interest can be achieved by both direct and indirect selection of characters that are more heritable and easier to select. The aim of this study was to determine the degree and nature of associations among morpho-agronomic traits, fatty acid contents and oil yield. One hundred twenty-six (120 accessions and six improved varieties) linseed (Linum usitatissimum L.) genotypes were evaluated for their morpho agronomic traits, fatty acid contents and oil yield using a Alpha lattice Design with two replications at farm fields of Holeta agricultural research center (HARC) and Kulumsa agricultural research center (KARC) during 2019/2020 cropping season in Ethiopia. Oil yield per hectare, seed yield per hectare showed a highly significant positive correlation at genotypic and phenotypic levels with plant height, number of primary braches, number of secondary branches, number of capsules, number of seeds per capsule, thousand seed weight, biological yield per plant, oil yield per plant and seed yield per plant, implying that selection based on these characters could enhance the seed yield per hectare, which ultimately would lead to an increase in oil yield per hectare. Seed yield per plant had the highest positive direct effect on seed yield and oil yield per hectare at both phenotypic and genotypic correlation levels at Holeta and Kulumsa locations. Therefore, to improve simultaneously seed yield and oil yield per hectare selection through seed yield per plant is effective.
Keywords: Genotypic correlation, Morpho agronomic traits, Fatty acid content, Oil yield, Phenotypic correlation, Selection
Introduction
Linseed, Linum usitatissimum L. (n=15), also called flax, is an important oilseed crop which belongs to the family linaceae. Linseed is the only widely grown and economically important species in Ethiopia. It is believed that this crop species may have originated from Linum angustifolium Huds (n=15), native to the Mediterranean region. The genus Linum has both cultivated and wild species. The wild species have little economic value. Almost all the species are annual herbs and some are shrubs, Linum usitatissimum L. is the only species with non-dehiscent or semi-dehiscent capsules suitable for modern cultivation of the family linaceae [1]. The crop is predominantly self pollinated, but out crossing (less than 2%) occasionally results from insect activity [2].
Linseed is one of the important oilseed crops of Ethiopia. Arsi, Bale, Chercher Mountains, Eastern Welega, Eastern Gojam, Tigray, southeast Welo, and Shewa are the major areas of production where frost is a problem for other oilseed crops such as noug (Guizotia abyssinicca cass) and Ethiopian mustard (Brassica carinata A.Braun) in Ethiopia. Linseed is a major oilseed and rotation crop for barley in higher elevations of Ethiopia [1]. Whereas on overseas countries linseed is widely grown in cool temperate regions of Argentina, Northern Europe, China, Russia, USA and Canada [3]. This crop is grown for fibre (fibre flax), seed oil (linseed) or both seed oil as well as fibre (example dual purpose flax linseed), but recently it has gained a new interest in the emerging market of functional food due to its high content of fatty acids, alpha linolenic acid (ALA), an essential Omega-3 fatty acid and lignin oligomers which constitute about 57 % of total fatty acids in linseed [4].
For any crop improvement programme, systematic study and evaluation of germplasm is of great importance for genetic improvement of the crop [5]. Seed and oil yields are complex traits and highly influenced by many genetic and environmental factors. So, direct selection for seed or oil yield as such could be misleading. A successful selection depends upon the information on the association of morpho-agronomic traits and biochemical properties with seed yield or oil yield [6]. The inter-relationship between important seed and oil yield components is best estimated by correlation coupled with path coefficient analysis. These techniques used in the breeding programme to exploit the yield potential for enhancing the productivity of the linseed and to develop high seed and oil yielding improved varieties.
Correlation is the mutual relationship between the variables, it aids in determining the most effective procedures for selection of superior genotypes. When there is positive correlation between major yield components, breeding strategies would be very effective but, on the reverse, selection becomes very difficult. Wakjira [7] reported seed yield per plot was highly significant and positively associated with seed yield per plant, thousand seed weight and capsule per plant. In addition, oil yield was significantly and positively associated with polyunsaturated linolenic fatty acids, whereas it was negatively correlated with unsaturated linoleic fatty acids [8]. Oil yield also had weak positive correlation with unsaturated oleic acid [9]. Tadesse [10] reported seed yield per plot was significantly associated with seed weight, seed yield per plant, harvest index and biomass at Robe and Sinana in Ethiopia. Path analysis indicated that harvest index and biomass were main determinate of yield per plot at both locations. Days to maturity and seed yield per plot had low negative direct effect on oil content. Seed yield had high positive direct effect and high positive correlation. This suggested that the simultaneous improvement in seed yield and oil content is possible in the material under his study. Mulusew [11]; Meena [12] reported that oil content was positive and significantly associated only with linolenic acid but negatively and significantly associated with palmitic acid, oleic acid and linolenic acid was negatively associated with linoleic acid. Crude protein and iodine value shows negative and non-significant correlation with other quality traits. The estimates of correlation coefficients alone may be often misleading due to mutual cancellation of component characters. So, study of correlation coupled with a path analysis is more effective tool in the study of yield contributing characters [13].
Path coefficient analysis is an important technique for partitioning the correlation coefficient into direct and indirect effect of the causal components on the complex component. Naik [14] reported biological yield per plant exerted high positive direct effects on seed yield. Patial [15] observed that harvest index exerts substantial negative direct effect on seed yield. The adequate information on extent of variability may also be helpful to improve the yield by selecting the yield component traits [16].
Identification and selection of major yield components is an essential prerequisite for linseed improvement. Keeping these considerations in mind, an attempt was made to assess the correlation among the yield components and their direct and indirect effect on seed yield.
Materials and Methods
Experimental Sites
The study was conducted during 2019/20 in central Oromia, Ethiopia in two selected locations, namely, Holeta (9003′41”N, 38o30′44″ E) and Kulumsa (08001′10”N, 39o09′11″ E). Holeta and Kulumsa are agricultural research stations of Ethipian Institute of Agricultural Research (EIAR). These two sites represent agro-ecology of central Oromia and favorable for highland oil crops in Ethiopia. Holeta and Kulumsa are situated at an altitude of 2400 and 2200 m above sea level and receive a total rainfall of 976 and 820 mm, respectively. The mean minimum and maximum temperatures at Holeta site range from 6.1 to 22.4 °C. Kulumsa has an average minimum and maximum temperature of 10.5 and 22.8 °C. Holeta and Kulumsa has nitosol and luvisol soil types and soil PH 4.9 and 6, respectively [17,18].
Experimental material
The seeds of 120 accessions were obtained from Ethiopian Biodiversity Institute (EBI) and the seeds of six improved varieties were obtained from Holeta and Kulumsa Agricultural Research Centers were used for this experiment. Belay-96, Berene and Kulumsa-1 released in 1997, 2001 and 2006, respectively, while Jeldu, Kasa-2 and Bekoji released in 2010, 2012 and 2014, respectively (Appendix Table 2) [19]. The 120 accessions were collected from different geographic regions and altitudes (Appendix Table 1).
Experimental Design and procedures
The experiment was conducted under field conditions and laid out using alpha lattice design [20], with two replications, at each location. In each replication there are 21 blocks and 6 plots in each block at each location. Each entry was planted in two rows plots measuring three meters in length, with an inter-row and intra-row spacing of 0.2 m and 0.1 m, respectively. The trials were maintained following the standard agronomic practices of linseed production [17,18]. Data were recorded from ten randomly selected competitive plants of each genotype characters namely DF= days to 50% flowering, DM= days to maturity, PH (cm)= plant height, PB= number of primary branches, SB= number of secondary branches, NC= number of capsules, NSC= number of seeds per capsule, TSW (g)= thousand seed weight, BYP (kg)= biological yield per plant, HI (%)= harvest index SYP (g)= seed yield per plant and SYD (kg ha-1)=seed yield per hectare. The quality characters were taken after harvesting the plants. The oil content, fatty acid content and quality characters of the seed such as CRB (%)= carbohydrate and PRT (%)=crude protein while the fatty acids composition content OA (%)= oleic acid, LN (%)= linoleic acid, LNN (%)=linolenic acid, OYP (%)= oil yield per plant, OYD (kg ha-1)= oil yield per hectare was determined at quality laboratory of Ethiopian Institute of agricultural research, Ethiopia, Holeta Highland Oil Crops Laboratory in Ethiopia [21].
Data Analysis
All the data were subjected to analysis using SAS software [25]. The analysis of variance (ANOVA) of each location (Holeta or Kulumsa) was carried out according to the model:
Pijks = µ + gi + bk(j)(s) + rj(s) + ls + (gl)is + eijks
Where: Pijks = phenotypic value of ith genotype under jth replication at sth location and kth incomplete block within replication j and location s; µ = grand mean; gi = the effect of ith genotype; bk(j)(s) = the effect of incomplete block k within replication j and location s; rj(s) = the effect of replication j within location s; ls = the effect of location s; (gl)is = the interaction effects between genotype and location; and eijks = the residual or effect.
Correlation coefficients
The correlation coefficients were calculated to determine the degree of association of characters with seed yield per hectare, yield components, oil yield per hectare and quality characters of the seed and among themselves. Phenotypic and genotypic correlations were computed by the formula suggested by Miller [22].
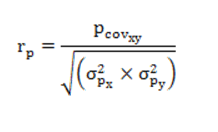
Where,
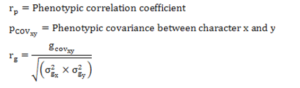
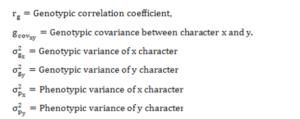
Where,
The coefficients of correlation will be tested using “r” tabulated value at n-2 degree of freedom, at 5% and 1% probability level, where n is the number of accessions described by Robertson [23].
Path coefficient analysis
Path coefficient analysis was carried out using the genotypic and phenotypic correlation coefficients to determine the direct and indirect effects of the yield components and seed quality related characters. Path coefficient analysis was also conducted to determine the direct and indirect effect of various traits on seed yield per hectare and oil yield per hectare using the general formula of Dewey and Lu [24].

Path coefficient:
Where,
rij = mutual association between the independent character (i) and dependent character (j) as measured by the correlation coefficients.
pij = components of direct effects of the independent character (i) on the dependent variable (j) as measured by the path coefficients and
Σrikpkj = summation of components of indirect effects of a given independent character (i) on a given dependent character (j) via all other independent characters (k).
The residual effects were estimated using the formula:

Data processing was done by SAS software [25]. The contribution of the remaining unknown characters was measured as the residual effect as demonstrated by Singh and Chaudhary [26].
Results and Discussion
Correlation Coefficients of Seed and Oil Yield per Hectare with other Traits at Two Locations
Correlation of Seed and Oil Yield per Hectare
Estimates of genotypic and phenotypic correlation coefficients at Holeta and Kulumsa environments are shown in Tables 1 and 2, respectively. The analysis of correlations in each location showed that genotypic correlation coefficients were generally higher than their corresponding phenotypic correlations indicating strong hereditary association among the traits due to genetic factors such as linkage and/or pleiotropic effect enabling consistent performance across wide range of environments as described by Waitt and Levin [27]. Seed and oil yield are very complex characters which are governed by polygenes and the result of numerous simple characters presumably showing considerable variations from one environment to another [28]. The correlation between the traits may be due to linkage or pleiotropy [16] or environment [29]. Similarly, a narrow difference between phenotypic and genotypic correlation coefficient was obtained for almost all the pairs of characters studied showing that masking or modifying effects of the environment was little demonstrating that the presence of an inherent association among these characters. Similar results were reported in linseed studies of Birhanu [9]; Deme [8]; Meena [12] and Mulusew [11].
| DF | DM | PH | PB | SB | NC | NSC | TSW | BYp | ||
| DF | 0.87** | -0.79** | -0.52** | -0.14 | -0.57** | -0.63** | -0.67** | -0.64** | ||
| DM | 0.87** | -0.72** | -0.48** | -0.12 | -0.61** | -0.62** | -0.76** | -0.60** | ||
| PH | -0.79** | -0.72** | 0.60** | 0.12 | 0.56** | 0.70** | 0.70** | 0.64** | ||
| PB | -0.52** | -0.48** | 0.60** | 0.23** | 0.52** | 0.67** | 0.64** | 0.65** | ||
| SB | -0.16 | -0.13 | 0.12 | 0.23** | 0.27** | 0.26** | 0.23** | 0.16 | ||
| NC | -0.57** | -0.61** | 0.56** | 0.52** | 0.27** | 0.62** | 0.68** | 0.54** | ||
| NSC | -0.63** | -0.62** | 0.70** | 0.67** | 0.27** | 0.62** | 0.76** | 0.82** | ||
| TSW | -0.65** | -0.72** | 0.66** | 0.62** | 0.23** | 0.62** | 0.74** | 0.68** | ||
| BYP | -0.64** | -0.60** | 0.64** | 0.65** | 0.17 | 0.54** | 0.82** | 0.66** | ||
| HI | 0.33** | 0.31** | -0.32** |
-0.33** |
0.1 | -0.22* | -0.47** | -0.31** | -0.80** | |
| CRB | 0.09 | 0.03 | -0.02 | -0.04 | -0.09 | -0.04 | -0.09 | -0.07 | -0.06 | |
| PRT | -0.01 | 0.06 | -0.02 | -0.03 | 0.04 | 0.02 | -0.03 | -0.01 | -0.03 | |
| OA | 0.07 | 0.12 | -0.05 | 0.06 | -0.01 | -0.01 | -0.03 | 0.01 | -0.03 | |
| LN | 0.1 | 0.05 | -0.08 | -0.14 | -0.03 | -0.04 | -0.13 | -0.07 | -0.13 | |
| LNN | -0.03 | -0.01 | -0.01 | -0.01 | 0.11 | -0.01 | 0.01 | 0.07 | 0.01 | |
| OYP | -0.70** | -0.70** | 0.71** | 0.67** | 0.27** | 0.63** | 0.83** | 0.77** | 0.80** | |
| SYP | -0.77** | -0.78** | 0.80** | 0.75** | 0.26** | 0.71** | 0.89** | 0.84** | 0.86** | |
| OYD | -0.48** | -0.44** | 0.49** | 0.55** | 0.26** | 0.49** | 0.63** | 0.51** | 0.64** | |
| SYD | -0.53** | -0.55** | 0.57** | 0.62** | 0.26** | 0.56** | 0.68** | 0.56** | 0.71** | |
| Tabular r=0.18 at 5%; r=0.23 at 1% | ||||||||||
| HI | CRB | PRT | OA | LN | LNN | OYP | Syp | OYD | SYD | ||
| DF | 0.33** | 0.07 | 0.01 | 0.04 | 0.07 | -0.07 | -0.69** | -0.77** | -0.68** | -0.76** | |
| DM | 0.30** | 0.03 | 0.09 | 0.1 | 0.04 | -0.07 | -0.70** | -0.78** | -0.69** | -0.77** | |
| PH | -0.31** | -0.03 | 0.01 | -0.04 | -0.06 | 0.02 | 0.70** | 0.80** | 0.72** | 0.82** | |
| PB | -0.33** | -0.06 | -0.06 | 0.07 | -0.14 | 0.01 | 0.68** | 0.75** | 0.67** | 0.73** | |
| SB | 0.11 | -0.05 | 0.05 | 0.01 | -0.02 | 0.09 | 0.25** | 0.25** | 0.25** | 0.26** | |
| NC | -0.21* | -0.05 | 0.01 | -0.01 | -0.02 | 0.03 | 0.63** | 0.71** | 0.60** | 0.68** | |
| NSC | -0.47** | -0.1 | -0.04 | -0.02 | -0.11 | 0.07 | 0.82** | 0.89** | 0.82** | 0.88** | |
| TSW | -0.31** | -0.06 | -0.06 | 0.01 | -0.07 | 0.11 | 0.79** | 0.87** | 0.78** | 0.86** | |
| BYP | -0.80** | -0.06 | -0.04 | -0.02 | -0.11 | 0.04 | 0.79** | 0.86** | 0.77** | 0.84** | |
| HI | 0.01 | 0.02 | 0.01 | 0.07 | 0.01 | 0.42** | -0.46** | -0.42** | -0.4** | ||
| CRB | 0.02 | -0.63** | -0.12 | 0.59** | -0.69** | -0.46** | -0.06 | -0.47** | -0.06 | ||
| PRT | 0.03 | -0.68** | 0.09 | -0.24** | 0.34** | 0.13 | -0.06 | 0.15 | -0.05 | ||
| OA | 0.02 | -0.11 | 0.1 | -0.14 | 0.09 | 0.06 | 0.02 | 0.06 | 0.02 | ||
| LN | 0.08 | 0.59** | -0.28** | -0.12 | -0.28** | -0.36** | -0.11 | -0.37** | 0.10 | ||
| LNN | 0.02 | -0.66** | 0.32** | 0.09 | -0.30** | 0.35** | 0.06 | 0.35** | 0.05 | ||
| OYP | -0.43** | -0.46** | 0.18* | 0.03 | -0.37** | 0.30** | 0.90** | 0.98** | 0.88 | ||
| SYP | -0.46** | -0.06 | -0.03 | 0.01 | -0.12 | 0.02 | 0.91** | 0.88** | 0.97** | ||
| OYD | -0.43** | -0.51** | 0.24** | 0.09 | -0.40** | 0.31** | 0.80** | 0.65** | 0.90** | ||
| SYD | -0.48** | -0.13 | 0.03 | 0.06 | -0.16 | 0.03 | 0.70** | 0.73** | 0.91** | ||
| Tabular r=0.18 at 5%; r=0.23 at 1% | |||||||||||
| *and **: significant at p < 0.05 and p < 0.01 probability levels, respectively. DF= days to 50% flowering, DM= days to maturity, PH (cm)= plant height, PB= number of primary branches, SB= number of secondary branches, NC= number of capsules per plant, NSC= number of seeds per capsule, TSW (g)= thousand seed weight, BYP (kg)= biological yield per plant, HI (%)= harvest index, CRB (%)= carbohydrate, PRT (%)= crude protein, OA (%)= oleic acid, LN (%)= linoleic acid, LNN (%)=linolenic acid, OYP (%)= oil yield per plant and SYP (g)= seed yield per plant, OYD (kg ha-1)= Oil yield per hectare, SYD(kg ha-1)=Seed yield per hectare | |||||||||||
Table 1: Phenotypic correlation coefficient between 19 morphoagronomic and oil traits of 126 linseed genotypes above diagonal at Holeta and below diagonal at Kulumsa in 2019/20.
| DF | DM | PH | PB | SB | NC | NSC | TSW | BYp | ||
| DF | 0.91** | -0.87** | -0.61** | -0.15 | -0.66** | -0.68** | -0.74** | -0.71** | ||
| DM | 0.90** | -0.81** | -0.54** | -0.13 | -0.67** | -0.66** | -0.80** | -0.65** | ||
| PH | -0.86** | -0.81** | 0.73** | 0.15 | 0.70** | 0.81** | 0.83** | 0.76** | ||
| PB | -0.60** | -0.54** | 0.73** | 0.26** | 0.62** | 0.78** | 0.71** | 0.74** | ||
| SB | -0.16 | -0.13 | 0.15 | 0.26** | 0.30** | 0.29** | 0.24** | 0.19* | ||
| NC | -0.65** | -0.67** | 0.70** | 0.62** | 0.30** | 0.67** | 0.76** | 0.61** | ||
| NSC | -0.68** | -0.66** | 0.82** | 0.77** | 0.29** | 0.67** | 0.83** | 0.89** | ||
| TSW | -0.73** | -0.77** | 0.80** | 0.69** | 0.25** | 0.71** | 0.82** | 0.78** | ||
| BYP | -0.71** | -0.65** | 0.76** | 0.74** | 0.20* | 0.61** | 0.89** | 0.77** | ||
| HI | 0.42** | 0.39** | -0.41** | -0.44** | 0.1 | -0.29** | -0.57** | -0.44** | -0.82** | |
| CRB | 0.09 | 0.02 | -0.05 | -0.02 | -0.1 | -0.04 | -0.09 | -0.07 | -0.06 | |
| PRT | 0.01 | 0.08 | 0.01 | -0.06 | 0.05 | 0.02 | -0.04 | -0.03 | -0.04 | |
| OA | 0.07 | 0.12 | -0.05 | 0.06 | 0.01 | -0.02 | -0.04 | 0.01 | -0.04 | |
| LN | 0.1 | 0.04 | -0.08 | -0.15 | -0.04 | -0.04 | -0.13 | -0.08 | -0.14 | |
| LNN | -0.05 | -0.02 | 0.01 | -0.03 | 0.13 | -0.04 | 0.03 | 0.09 | 0.02 | |
| OYP | -0.74** | -0.71** | 0.80** | 0.74** | 0.29** | 0.66** | 0.86** | 0.83** | 0.83** | |
| SYP | -0.80** | -0.80** | 0.90** | 0.82** | 0.27** | 0.75** | 0.93** | 0.90** | 0.90** | |
| OYD | -0.47** | -0.43** | 0.50** | 0.56** | 0.27** | 0.50** | 0.64** | 0.52** | 0.65** | |
| SYD | -0.52** | -0.54** | 0.58** | 0.63** | 0.23** | 0.57** | 0.69** | 0.57** | 0.72** | |
| Tabular r=0.18 at 5%; r=0.23 at 1% | ||||||||||
| HI | CRB | PRT | OA | LN | LNN | OYP | SYP | OYD | SYD | |
| DF | 0.42** | 0.07 | 0.01 | 0.05 | 0.08 | -0.08 | -0.73** | -0.81** | -0.67** | -0.75** |
| DM | 0.39** | 0.03 | 0.08 | 0.11 | 0.04 | -0.09 | -0.71** | -0.80** | -0.68** | -0.76** |
| PH | -0.41** | -0.04 | -0.01 | -0.03 | -0.07 | 0.03 | 0.79** | 0.89** | 0.73** | 0.83** |
| PB | -0.44** | -0.06 | -0.05 | 0.09 | -0.15 | -0.01 | 0.75** | 0.82** | 0.68** | 0.74** |
| SB | 0.11 | -0.05 | 0.05 | 0.02 | -0.02 | 0.1 | 0.27** | 0.27** | 0.26** | 0.27** |
| NC | -0.29** | -0.04 | 0.02 | 0.02 | -0.03 | 0.01 | 0.66** | 0.75** | 0.61** | 0.69** |
| NSC | -0.57** | -0.09 | -0.04 | -0.02 | -0.12 | 0.07 | 0.86** | 0.93** | 0.83** | 0.89** |
| TSW | -0.46** | -0.07 | -0.03 | 0.02 | -0.06 | 0.13 | 0.83** | 0.92** | 0.79** | 0.87** |
| BYP | -0.81** | -0.06 | -0.04 | -0.02 | -0.12 | 0.06 | 0.83** | 0.90** | 0.78** | 0.85** |
| HI | 0.03 | 0.03 | 0.01 | 0.08 | -0.02 | -0.51** | -0.55** | -0.41** | -0.45** | |
| CRB | 0.02 | -0.65** | -0.13 | 0.62** | -0.78** | -0.46** | -0.06 | -0.46** | -0.06 | |
| PRT | 0.1 | -0.70** | 0.1 | -0.26** | 0.42** | 0.16 | -0.05 | 0.15 | -0.05 | |
| OA | -0.55** | -0.11 | 0.1 | -0.14 | 0.12 | 0.06 | 0.02 | 0.06 | 0.02 | |
| LN | 0.1 | 0.61** | -0.27** | -0.12 | -0.34** | -0.38** | -0.11 | -0.36** | -0.11 | |
| LNN | 0.01 | -0.74** | 0.38** | 0.1 | -0.34** | 0.38** | 0.06 | 0.36** | 0.05 | |
| OYP | -0.51** | -0.45** | 0.18* | 0.03 | -0.39** | 0.33** | 0.91** | 0.97** | 0.89** | |
| SYP | -0.55** | -0.05 | -0.05 | 0.01 | -0.12 | 0.02 | 0.91** | 0.89** | 0.98** | |
| OYD | -0.44** | -0.51** | 0.25** | 0.09 | -0.39** | 0.32** | 0.81** | 0.66** | 0.92** | |
| SYD | -0.47** | -0.13 | 0.03 | 0.06 | -0.16 | 0.03 | 0.71** | 0.74** | 0.91** | |
| Tabular r=0.18 at 5%; r=0.23 at 1% | ||||||||||
| *and **: significant at p < 0.05 and p < 0.01 probability levels, respectively. DF= days to 50% flowering, DM= days to maturity, PH (cm)= plant height, PB= number of primary branches, SB= number of secondary branches, NC= number of capsules per plant, NSC= number of seeds per capsule, TSW (g)= thousand seed weight, BYP (kg)= biological yield per plant, HI (%)= harvest index, CRB (%)= carbohydrate, PRT (%)= crude protein, OA (%)= oleic acid, LN (%)=linoleic acid, LNN (%)=linolenic acid, OYP (%)= oil yield per plant and SYP (g)= seed yield per plant, OYD (kg ha-1)= Oil yield per hectare, SYD(kg ha-1)=Seed yield per hectare. | ||||||||||
Table 2: Genotypic correlation coefficient between 19 morphoagronomic and oil traits of 126 linseed genotypes above diagonal at Holeta and below diagonal at Kulumsa in 2019/20.
Correlation among Seed and Oil Yield per Hectare and Yield Components
Genotypic and phenotypic correlations for all possible combinations of traits at phenotypic and genotypic correlation estimates between seed yield per hectare and the various characters at Holeta and Kulumsa were presented in Table 1and Table 2, respectively. At genotypic and phenotypic levels seed yield per hectare had highly significant positive correlations with plant height, number of primary braches, number of secondary branches, number of capsules, number of seeds per capsule, thousand seed weight, biological yield per plant, oil yield per plant, seed yield per plant and oil yield per hectare, indicating that selection based on these parameters would considerably enhance seed yield per hectare. These results partially agree with the finding of Patil [15] and Tadesse [10].
At both locations besides seed yield per hectare, the oil yield per hectare showed a highly significant positive correlation at genotypic and phenotypic levels with plant height, number of primary branches, number of secondary branches, number of capsules, number of seeds per capsule, thousand seed weight, biological yield per plant, linolenic fatty acid and oil yield per plant, seed yield per plant and seed yield per hectare, implying that selection based on these characters could enhance the oil yield per hectare. This result agrees with the finding of Birhanu [9], Patial [15]) and Kumar [30].
Seed yield per hectare had highly significant negative correlations at phenotypic and genotypic levels at both locations with days to flowering, days to maturity, and harvest index, suggesting that early maturity would favorably enhance seed yield per hectare. This result agree with the finding of Deme [8], Patial [15] and Kumar [30] and partially agree with findings of Tadesse [10].
Crude protein content had positive significant phenotypic and genotypic correlation coefficient with oil yield per hectare at Kulumsa, implying that selection based on crude protein content using phenotypic and genotypic correlation at Kulumsa could enhance the oil yield per hectare. This result agrees with the finding of Deme [8] and Patial [15].
Besides oil yield per hectare, seed yield per hectare showed a highly significant positive correlation at genotypic and phenotypic levels with plant height, number of primary braches, number of secondary branches, number of capsules, number of seeds per capsule, thousand seed weight, biological yield per plant, oil yield per plant and seed yield per plant, implying that selection based on these characters could enhance the seed yield per hectare, which ultimately would lead to an increase in oil yield per hectare. This result agrees with the finding of Patial [15] and Tadesse [10].
Days to 50% flowering, days to maturity, harvest index, carbohydrate and linoleic fatty acid content had negative and highly significant phenotypic and genotypic correlation coefficients with oil yield per hectare at both locations, suggesting that early maturity would favorably enhance oil yield per hectare. This result agrees with the finding of Meena [12], Mulusew [11] and Wakjira [7].
At both locations, among all fatty acids, linoleic acid showed a highly significant negative association with linolenic acid at phenotypic and genotypic levels. This negative correlation of linolenic acid with linoleic acid can be best understood by the fatty acid biosynthesis pathway. You [28] found that both linoleic and linolenic acids have a common biosynthesis pathway, so one can increase at the cost of the other. Similar findings were also reported by Deme [8] and Pali & Mehta [31]. The results obtained in the present study indicate that high oil yield per hectare will result in high linolenic acid and reduce linoleic acids. However, Birhanu [9] suggested that an increase in oil yield per hectare will lead to an increase in linolenic acid. Deme [8] also observed a negative association of linoleic acid with linolenic acid. Considering the obtained results, the present study suggests that selection to increase oil yield per hectare would not affect linseed oil quality, since selection does not affect total fatty acid compositions, despite the noticeable changes in different fatty acids.
The Phenotypic Path Coefficient Analysis of Seed Yield per Hectare at Holeta and Kulumsa
Seed yield per hectare was the dependent variable while other evaluated morphoagronomic traits, oil yield and fatty acid contents which are significantly correlated at phenotypic level were considered as independent variables. Direct and indirect effects of these components were determined on seed yield per hectare and their contributions in each of the two environments are shown in Table 3. The path coefficient analysis at phenotypic level revealed at Holeta and Kulumsa, respectively that biological yield per plant (0.866 and 0.731), seed yield per plant (0.964 and 0.742) and oil yield per hectare (0.913 and 0.896) had the highest positive direct effect on seed yield per hectare. Similarly, biological yield per plant (rp= 0.84**, rp= 0.71**), seed yield per plant (rp= 0.97**, rp= 0.73**) and oil yield per hectare (rp= 0.90**, rp= 0.91**), had highly significant and positive correlations with seed yield per hectare in each location (Holeta and Kulumsa), respectively at phenotypic level. The phenotypic correlations were almost equal to their direct effects, then correlation explains the true relationship and a direct selection through these traits will be effective in order to improve seed yield per hectare of linseed. These results are in agreement with the findings of Meena [12]; Patial [15]; Tadesse [10] for biological yield per plant.
It was observed that thousand seed weight and oil yield per plant exhibited positive and relatively low direct effect and high, positive correlation with seed yield per hectare at Holeta and Kulumsa (Table 3). Traits such as oil yield per plant and thousand seed weight exerted positive indirect effects on seed yield per hectare via biological yield per plant, seed yield per plant and oil yield per hectare in both environments (Table 3). Number of secondary branches showed relatively higher negative indirect effect to seed yield per hectare through biological yield per plant. Similar results were reported by Patial [15] where number of secondary branches showed relatively higher negative indirect effect to seed yield per hectare through biological yield per plant was observed.
Plant height, number of primary braches, number of capsules and number of seeds per capsule had negligible direct positive effect and positive, highly significant correlation at phenotypic level with seed yield per hectare. Number of secondary branches had negative direct effect but positive highly significant phenotypic correlation with seed yield per hectare at both locations. These indicate that the indirect effects seem to be the reason of correlation. In such situations, the indirect causal factors must be considered simultaneously.
Days to 50% flowering and harvest index had positive direct effect but negative highly significant phenotypic correlation at both locations. Under these circumstances, a restricted selection model is to be followed, that is restrictions are to be imposed to nullify the undesirables indirect effects, in order to make use of the direct effects. Days to maturity had negative direct effect and negative highly significant correlation at phenotypic level at both locations, indicating selection of early maturity is effective for improving seed yield per hectare.
The residual effects of the present study were 0.027767 and 0.02908 at Holeta and Kulumsa, respectively which means the characters in the path analysis expressed the variability in seed yield per hectare by 97.2233% and 97.092%, respectively.
|
Location |
Trait | DF |
DM |
PH | PB | SB | NC | NSC | TSW | BYP | HI | OYP | Syp | OYD | SYD rp |
| Holeta | DF | 0.126 | -0.12 | -0.001 | -0.03 | 0.003 | -0.02 | -0.06 | -0.16 | -0.42 | 0.095 | -0.02 | -0.07 | -0.08 | -0.76** |
| Kulumsa | DF | 0.127 | -0.15 | -0.1 | -0.1 | 0.003 | -0.07 | -0.08 | -0.07 | -0.04 | 0.096 | -0.09 | -0.05 | -0.01 | -0.53** |
| Holeta | DM | 0.022 | -0.14 | -0.06 | -0.03 | 0.002 | -0.07 | -0.18 | -0.12 | -0.08 | 0.087 | -0.08 | -0.05 | -0.08 | -0.77** |
| Kulumsa | DM | 0.043 | -0.17 | -0.07 | -0.03 | 0.003 | -0.03 | -0.06 | -0.08 | -0.07 | 0.098 | -0.05 | -0.07 | -0.06 | -0.55** |
| Holeta | PH | -0.02 | 0.098 | 0.09 | 0.039 | -0.002 | 0.025 | 0.068 | 0.177 | 0.208 | -0.09 | 0.083 | 0.059 | 0.084 | 0.82** |
| Kulumsa | PH | -0.309 | 0.12 | 0.097 | 0.043 | -0.007 | 0.031 | 0.069 | 0.074 | 0.303 | -0.09 | 0.095 | 0.077 | 0.068 | 0.57** |
| Holeta | PB | -0.013 | 0.066 | 0.054 | 0.064 | -0.004 | 0.023 | 0.065 | 0.099 | 0.271 | -0.1 | 0.08 | 0.043 | 0.079 | 0.73** |
| Kulumsa | PB | -0.026 | 0.081 | 0.059 | 0.071 | -0.231 | 0.029 | 0.066 | 0.149 | 0.407 | -0.1 | -0.06 | 0.072 | 0.096 | 0.62** |
| Holeta | SB | 0.019 | 0.017 | 0.011 | 0.015 | -0.018 | 0.112 | 0.026 | 0.088 | -0.1 | 0.03 | -0.03 | 0.064 | 0.029 | 0.26** |
| Kulumsa | SB | -0.017 | 0.021 | 0.012 | 0.016 | -0.02 | 0.015 | 0.026 | 0.026 | 0.104 | -0.06 | 0.036 | 0.023 | 0.045 | 0.23** |
| Holeta | NC | -0.015 | 0.084 | 0.051 | 0.034 | -0.005 | 0.043 | 0.111 | 0.105 | 0.142 | -0.06 | 0.074 | 0.048 | 0.07 | 0.68** |
| Kulumsa | NC | -0.028 | 0.013 | 0.055 | 0.037 | -0.005 | 0.056 | 0.061 | 0.07 | 0.146 | -0.06 | 0.084 | 0.068 | 0.068 | 0.56** |
| Holeta | NSC | -0.016 | 0.085 | 0.063 | 0.043 | -0.005 | 0.027 | 0.097 | 0.045 | 0.124 | -0.16 | -0.1 | 0.58 | 0.096 | 0.88** |
| Kulumsa | NSC | -0.031 | 0.066 | 0.093 | 0.048 | -0.004 | 0.035 | 0.099 | 0.082 | 0.124 | -0.02 | -0 | 0.098 | 0.095 | 0.68** |
| Holeta | TSW | -0.017 | 0.104 | 0.063 | 0.041 | -0.004 | 0.03 | 0.074 | 0.154 | 0.246 | -0.09 | 0.093 | 0.076 | 0.091 | 0.86** |
| Kulumsa | TSW | -0.032 | 0.121 | 0.064 | 0.045 | -0.005 | 0.035 | 0.073 | 0.111 | 0.123 | -0.06 | -0.06 | 0.075 | 0.065 | 0.56** |
| Holeta | BYP | -0.484 | 0.081 | 0.058 | 0.082 | -0.278 | 0.084 | 0.08 | 0.088 | 0.866 | -0.1 | 0.2 | 0.084 | 0.076 | 0.84** |
| Kulumsa | BYP | -0.107 | 0.1 | 0.063 | 0.046 | -0.326 | 0.03 | 0.080 | 0.052 | 0.731 | -0.12 | 0.16 | 0.177 | 0.127 | 0.71** |
| Holeta | HI | 0.074 | -0.04 | -0.03 | 0.098 | -0.002 | -0.01 | -0.05 | -0.05 | -0.52 | 0.285 | -0.05 | -0.06 | -0.05 | -0.40** |
| Kulumsa | HI | 0.017 | -0.05 | -0.03 | -0.02 | -0.002 | -0.01 | -0.05 | -0.03 | -0.4 | 0.286 | -0.09 | -0.04 | -0.05 | -0.48** |
| Holeta | OYP | -0.018 | 0.095 | 0.063 | 0.041 | -0.057 | 0.027 | 0.08 | 0.122 | 0.496 | -0.19 | 0.118 | 0.057 | 0.051 | 0.88** |
| Kulumsa | OYP | -0.097 | 0.117 | 0.069 | 0.035 | -0.098 | 0.035 | 0.082 | 0.086 | 0.385 | -0.22 | 0.133 | 0.086 | 0.091 | 0.70** |
| Holeta | SYP | -0.03 | -0.1 | 0.015 | 0.004 | 0.008 | -0.15 | 0.046 | 0.053 | 0.001 | 0.015 | 0.062 | 0.964 | 0.085 | 0.97** |
| Kulumsa | SYP | -0.213 | 0.282 | 0.061 | -0.1 | 0.021 | -0.1 | -0.1 | -0.04 | 0.266 | -0.06 | -0.12 | 0.742 | 0.085 | 0.73** |
| Holeta | OYD | -0.001 | -0.01 | 0.103 | 0.003 | -0.005 | -0.11 | 0.042 | 0.047 | 0.001 | 0.014 | -0.2 | 0.095 | 0.913 | 0.90** |
| Kulumsa | OYD | -0.133 | -0.14 | 0.037 | -0.01 | 0.015 | -0.13 | -0.1 | -0.03 | 0.098 | -0.01 | -0.17 | 0.583 | 0.896 | 0.91** |
| Holeta Residual=0.027767 at Kulumsa Residual=0.02908 | |||||||||||||||
Table 3: Direct (bold and underlined) and indirect effects (off diagonal) of traits on seed yield per hectare at phenotypic level at two location in 2019/20.
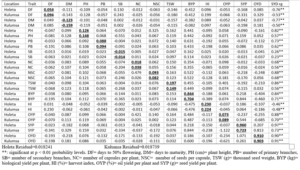
Table 4: Direct (bold and underlined) and indirect effects (off diagonal) of traits on seed yield per hectare at genotypic level at two location in2019/20.
The Genotypic Path Coefficient Analysis of Seed Yield per hectare at Holeta and Kulumsa
The path coefficient analysis at genotypic level at Holeta and Kulumsa (Table 5) showed that biological yield per plant (0.844 and 0.704), seed yield per plant (0.96 and 0.723) and oil yield per hectare (0.91 and 0.903) had the highest positive direct effect on seed yield per hectare. Similarly, biological yield per plant (rg=0.84** and rg=0.71**), seed yield per plant (rg=0.97** and rg=0.73**) and oil yield per hectare (rg=0.90** and rg=0.91**) had highly significant and positive correlations with seed yield per hectare in each location (Holeta and Kulumsa) at genotypic level. The genotypic correlation were almost equal to their direct effects, then correlation explains the true relationship and a direct selection through these traits will be effective in order to improve seed yield per hectare of linseed. These results are in agreement with the findings of Meena [12]; Patial [15]; Tadesse [10] for biological yield per plant.
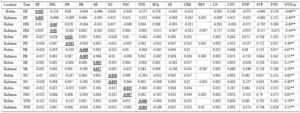
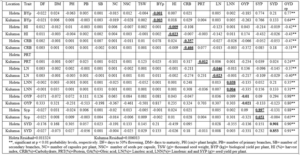
Table 5: Direct (bold and underlined) and indirect effects (off diagonal) of traits on oil yield per plant at phenotypic level at two location in 2019/20.
Thousand seed weight and plant height exhibited positive direct effect on seed yield per hectare at Holeta and Kulumsa (Table 5). Plant height and thousand seed weight exerted positive indirect effects on seed yield per hectare via biological yield per plant, seed yield per plant and oil yield per hectare in both environments (Table 4). Harvest index showed relatively higher negative indirect effect to seed yield per hectare through biological yield per plant, seed yield per plant and oil yield per hectare. Similar results were reported by Meena [12] where harvest index showed relatively higher negative indirect effect to seed yield per hectare through biological yield per plant and seed yield per plant was observed.
Number of primary braches, number of capsules, and number of seeds per capsule had positive negligible direct effect and positive highly significant correlation at genotypic level with seed yield per hectare. Number of secondary branches had negligible negative direct effect but positive highly significant genotypic correlation with seed yield per hectare at both locations. These indicate that the indirect effects seem to be the reason of correlation. In such situations, the indirect causal factors must be considered simultaneously.
Days to 50% flowering had positive negligible direct effect and negative highly significant correlation at genotypic level with seed yield per hectare. This indicates the indirect effects made unfavorable environment to seed yield per hectare via days to 50% flowering.
Harvest index had positive moderate direct effect but negative highly significant genotypic correlation at both locations. This indicates to impose restrictions to nullify the undesirables’ indirect effects, in order to make use of the direct effects.
Days to maturity had negative direct effect and negative highly significant correlation at genotypic level at both locations, indicating selection of early maturity is effective for improving seed yield per hectare.
The residual effects of the present study were 0.018241 and 0.018739 at Holeta and Kulumsa, respectively which means the characters in the path analysis expressed the variability in seed yield per plant by 98.1759% and 98.1261%, respectively.
The Phenotypic Path Coefficient Analysis of Oil Yield per Hectare at Holeta and Kulumsa
Oil yield per hectare was the dependent variable while other evaluated traits were considered as independent variables. Direct and indirect effects of these components were determined on oil yield per hectare and their contributions in each of the two environments are shown in Table 5. The path coefficient analysis at phenotypic level revealed at Holeta and Kulumsa, respectively that seed yield per plant (0.897 and 0.651) and seed yield per hectare ( 0.901 and 0.909) had the highest positive direct effect on oil yield per hectare. Similarly, oil yield per hectare had highly significant and positive correlations with seed yield per plant (rp= 0.90**, rp= 0.91**) and seed yield per hectare (rp=0.90** and rp=0.91**) in each location (Holeta and Kulumsa), respectively at phenotypic level, indicating the need for direct selection for these traits in order to improve oil yield per hectare of linseed. These results are in agreement with the findings of Birhanu [9]; Deme [8]; Mulusew [11] for seed yield per plant.
It was observed that number of secondary branches and linolenic fatty acid exhibited negligible positive direct effect on oil yield per hectare and highly significant phenotypic correlation at both locations. Plant height, number of primary branches, number of capsules, number of seeds per capsule, thousand seed weight biological yield per plant and oil yield per plant had positive highly significant correlation at phenotypic level with oil yield per hectare but the direct effect was negative and negligible, indicate the indirect effects seem to be the cause of correlation.
Days to 50% flowering had negative highly significant correlation with oil yield per hectare but positive negligible direct effect. This is mainly due to unfavorable indirect effect on oil yield per hectare via days to 50% flowering.
Days to maturity, harvest index, carbohydrate content and linoleic fatty acid had negative highly significant correlation and negative direct effect on oil yield per hectare. This indicates selections of early days to maturity containing genotypes are important to improve oil yield per hectare.
At Kulumsa crude protein content had positive highly significant correlation at phenotypic level with oil yield per hectare but the direct effect was negative and negligible, then the indirect effects seem to be the cause of correlation. The residual effects of the present study were 0.011324 and 0.006013 at Holeta and Kulumsa, respectively which means the characters in the path analysis expressed the variability in oil yield per hectare by 99.8676% and 99.3987%, respectively.
The Genotypic Path Coefficient Analysis of Oil Yield Per Hectare at Holeta and Kulumsa
The path coefficient analysis at genotypic level at Holeta and Kulumsa (Table 6), revealed that linolenic fatty acid (0.362 and 0.321), seed yield per plant (0.891 and 0.661) and seed yield per hectare a (0.906 and 0.913) had the highest positive direct effect on oil yield per hectare. Similarly, linolenic fatty acid (rg=0.36** and rg=0.32**), seed yield per plant (rg=0.89** and rg=0.66**) and seed yield per hectare (rg=0.91** and rg=0.92**) had highly significant and positive correlations with oil yield per hectare in each location (Holeta and Kulumsa), at genotypic level. The genotypic correlations were almost equal to their direct effects, then correlation explains the true relationship and a direct selection through these traits will be effective in order to improve oil yield per hectare of linseed. These results are in agreement with the findings of Birhanu [9]; Deme [8]; Meena [12] for seed yield per plant.
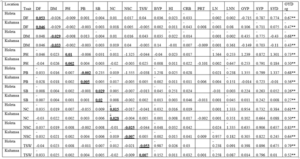
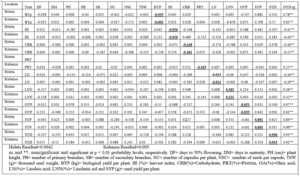
Table 6: Direct (bold and underlined) and indirect effects (off diagonal) of traits on oil yield per plant at genotypic level at two location in 2019/20.
Plant height, number of primary branches, number of secondary branches, number of capsules, number of seeds per capsule, thousand seed weight and biological yield per plant had positive highly significant correlation at genotypic level with oil yield per hectare but their direct effect was negligible negative or positive. At Kulumsa crude protein content had positive significant correlation at genotypic level with oil yield per hectare but the direct effect was negative and negligible, this indicates that the indirect effects seem to be the reason of correlation.
Days to 50% flowering had negative highly significant correlation with oil yield per hectare but positive negligible direct effect. This is mainly due to unfavorable indirect effect on oil yield per hectare via days to 50% flowering.
Days to maturity, harvest index, carbohydrate content and linoleic fatty acid had negative highly significant correlation with oil yield per hectare and negative direct effect on oil yield per hectare. This indicates selections of reduced days to maturity containing genotypes are important to improve oil yield per hectare.
The residual effects of the present study were 0.0042 and 0.005 at Holeta and Kulumsa, respectively which means the characters in the path analysis expressed the variability in oil yield per plant by 99.58% and 99.5%, respectively.
Conclusion
Oil yield per hectare, seed yield per hectare showed a highly significant positive correlation at genotypic and phenotypic levels with plant height, number of primary braches, number of secondary branches, number of capsules, number of seeds per capsule, thousand seed weight, biological yield per plant, oil yield per plant and seed yield per plant, implying that selection based on these characters could enhance the seed yield per hectare, which ultimately would lead to an increase in oil yield per hectare. Seed yield per plant had the highest positive direct effect on seed yield and oil yield per hectare at both phenotypic and genotypic correlation levels at Holeta and Kulumsa locations. Therefore, to improve simultaneously seed yield and oil yield per hectare selection through seed yield per plant is effective.
Days to maturity had negative highly significant correlation with seed yield and oil yield per hectare and negative direct effect on oil yield and seed yield per hectare. This indicates selections of reduced days to maturity containing genotypes are important to improve oil yield and seed yield per hectare simultaneously.
References
- Alemaw G, Alemayehu N (1997) Highland Oil Crops: A Three Decade Research Experience in Ethiopia. Research report No. 30. Institute of Agricultural Research, Addis Abeba, Ethiopia.
- Dilman AC, Hopper TH (1928) Effect of climate on the yield and oil content of flaxseed and on iodine number of linseed oil. USDA Tech. Bull. 844: 1-69.
- FAOSTAT (2019) Food and Agriculture Organization of the United Nations. FAO Statistical Databases.
- Goyal A, Sharma V, Upadhyay N, Gill S, Sihag M (2014) Flax and flaxseed oil: an ancient medicine & modern functional food. Journal of Food Science and Technology 51: pp 1633–1653.
- Tyagi AK, Sharma MK, Mishra SK, Kumar R, Kumar P, et al. (2015) Evaluation of genetic divergence in Linseed (Linum usitatissimum L.) Germplasm. Progressive Agriculture: 15: 128-33
- Hussain F, Iqbal MS (2013) Trait association of yield and yield components of linseed (Linum usitatissimum L.). International Journal of Modern Agriculture 2:114-117.
- Labuschagne M, Hugo A (2004) Variability in oil content and fatty acid composition of Ethiopian and introduced cultivars of linseed. Sci. Food Agric84: 1-8.
- Tesfaye D, Gulelat H, Nugssie R, Ashagrie W, Mulat G (2021) Fatty Acid Profile, Total Phenolic Content, and Antioxidant Activity of Niger Seed (Guizotia abyssinica) and Linseed (Linum usitatissimum). Frontiers in Nutrition: 8.
- Mengistu B, Abu M, Amsalu F (2022) Fatty Acid Composition and Correlation Analysis of Linseed (Linum Usitatissimum L.) Genotypes. J Plant Biol Crop Res 5: 1053.
- Tadesse T, Singh H, Weyessa B (2010) Correlation and path coefficient analysis among seed yield traits and oil content in Ethiopian linseed Germplasm. J. Sustain. Crop Prod 4: 08-16.
- Mulusew F, Firew M, Wakjira A (2013) Seed oil diversity of Ethiopian linseed (Linum usitatissimum L.) landraces accessions and some exotic cultivars. African Journal of Biochemistry Research 7: 76–85.
- Meena AK, Kulhari S, Kumar M, Koli NR, Tak Y (2020) Studies on Genetic Variability and Character Association in Linseed (Linum usitatissimum L.) Genotypes. International Journal of Current Microbiology and Applied Sciences 9: 3949-3957.
- Rajanna BS, Ajithkumar K (2014) Correlation and Path Coefficient Analysis in Linseed (Linum usitatissimum)” Aninter National J. Quart. Life Sci 9: 1625-1628
- Naik BS, Dash J, Mohapatra UB (2016) Path-coefficient analysis of seed yield and its components in linseed (Linum usitatissimum L.) – A review. J. Advanced Res 4: 1571-1579.
- Patil VD, Makne VG, Chaudhari VP (2019) Association analysis in linseed. Indian J.Genet. 40: 235-237.
- Singh A, Tewari N, (2018) Predictors of linseed improvement identified through correlation and path coefficient analysis. Adv. Agric. Sci. 7: 114-116.
- Annual Research Report for the Period 2015/16; Holeta Agricultural Research Centre: Oromia, Ethiopia, 2016.
- Annual Research Report for the Period 2015/16; Kulumsa Agricultural Research Centre: Oromia, Ethiopia, 2016.
- EAA (Ethiopian Agriculture Authority). 2021. Plant Variety Release, Protection and Seed Quality Control Directorate, Crop Variety Register, Issue No. 24, June 2021, Addis Ababa, Ethiopia.
- Patterson and Williams; A New Class of Resolvable Incomplete Block Design, Biometrika Vol,63. No.1 (April,1976), pp83-92.
- Daniel B, Solomon A, Wossen K (2008) Laboratory manual for plant product analysis. Ethiopia. Technical Manual 1(23):3-10.
- Miller PA, Williams JC, Robinsin HF, Comstock RF (1958) Estimation of genotypic and environmental variances and covariance’s in upland cotton and their implication in selection. J. 50:126-131.
- Robertson A (1959) The sampling variance of the genetic correlation coefficient. Biometrics 15: 469-485.
- Dewey DR, Lu KH (1959) A correlation and path coefficient of components of crested wheat grass seed production. Agronomy Journal 51: 515-518.
- SAS Institute. 2008. SAS/STAT guide for personal computers, version 9.2 edition. Cary, NC: SAS Institute Inc.
- Singh RK, Chaudhary BD (1985) Biometrical methods in quantitative genetic analysis. Revised, Kalyani Publishers, Ludhiana, New Delhi, India.
- Waitt DE, Levin DA (1998) Genetic and phenotypic correlations in plants: a botanical test of Cheverud’s conjecture. Heredity 80:310-319.
- You FM, Li P, Kumar S, Ragupathy R, Li Z, et al. (2018) Genome-wide identification and characterization of the gene families controlling fatty acid biosynthesis in flax (Linum usitatissimum L). Journal of Proteomics and Bioinformatics 7: 310-326.
- Allard RW (1999) Principles of Plant Breeding. 2ndedition, John Willey and Sons, Inc., New York.
- Kumar N, Paul S (2018) Selection Criteria of linseed genotypes for seed yield traits through correlation, path coefficients and principal component analysis. The Journal of Animal & Plant Sciences 26: 1688-1695.
- Pali R, Mahta DA (2019) comparative analysis of genetic variability in linseed (Linum usitatissimum L.) under normal and late sown conditions. Journal of Pharmacognosy and Phytochemistry 7: 3956-3958