Population Dynamics of a COVID-19 Model with Isolation and Non-Linear Recovery Rate Timothy Terfa Ashezua1*, Ninuola Ifeoluwa Akinwande2, Philip Aondofa Wayo3
Timothy Terfa Ashezua1*, Ninuola Ifeoluwa Akinwande2, Philip Aondofa Wayo3
1Department of Mathematics, Joseph Sarwuan Tarka University, Makurdi, Nigeria
2Department of Mathematics, Federal University of Technology, Minna, Nigeria
3Department of Mathematics, National Open University of Nigeria, Jabi, Abuja, Nigeria
*Correspondence to: Timothy Terfa Ashezua
Citation: Ashezua TT, Akinwande NI, Wayo PA (2024) Population Dynamics of a COVID-19 Model with Isolation and Non-Linear Recovery Rate. Sci Academique 5(2): 89-101.
Received: 3 October, 2024; Accepted: 29 October, 2024; Published: 6 November, 2024
Abstract
COVID-19 has in recent times created a major health concern in both developed and developing parts of the world. In this wise, there is every need to theoretically explore ways that will provide some insights into curtailing the spread of the disease in the population. In this paper, we present a population model for COVID-19 pandemic incorporating isolation and non- linear recovery rate. The reproduction number was obtained using the next generation method. The disease-free equilibrium (DFE) of the model (1) was found to be locally and globally asymptotically stable whenever the associated reproduction number is less than unity. Results from the sensitivity analysis of the model, using the reproduction number, Rc show that the top parameters that largely drive the dynamics of COVID-19 in the population are COVID- 19 transmission rate and the proportion of individuals progressing to the class of reported symptomatic infectious individuals. Numerical simulations of the model shows that increasing the recovery rate of infected patients in the population will lead to an initial decrease in the number of hospitalized patients before subsequent increase. The reason for this could be attributed to the number of unreported symptomatic infectious individuals who are progressing to reported symptomatic infectious stage of infection for immediate isolation.
Keywords: COVID-19, Reproduction number, Isolation, Stability, Nonlinear recovery rate
Introduction
Coronavirus disease 2019 (COVID-19) is a highly contagious infectious disease caused by severe acute respiratory syndrome coronavirus 2 (SARS-COV-2) Coronavirus are a family of viruses that can cause respiratory illness in human from both developed and developing countries of the world [5]. The disease, accounts for about 6 million deaths globally [9]. Coronaviruses are often found in bats, cats and camels. SARS-COV-2, the virus that causes COVID-19, enters the body through the mouth, nose or eyes (that is, directly from the airborne droplets or from the transfer of the virus from the hand to the face) [5].
The virus can be contracted due to the respiratory droplets released into the air when an infected person coughs, sneezes, talks, sings or breathes near an individual. An individual may be infected if these droplets are inhaled [5]. As stated in Khan et al. [7], isolation of infected individuals play a vital role in managing the spread of an infectious diseases.
Mathematical modelling has been a veritable tool over the years utilized to provide useful insights into the transmission dynamics, prevention and control of infectious diseases [2,14]. Many authors have conducted research works on COVID-19, for example, Samui et al. [12] designed and analyzed a mathematical model to study the reported and unreported cases of COVID-19 in India. In their work, they predicted the possibility of the disease reaching its peak after 60 days and will continue to subsequently persist for a long time. Tang et al. [13] proposed a model for COVID-19 by considering symptomatic individuals to get the patient’s epidemiological status and obtained the reproduction number of the model as 6.47. Rai, et al. [10] explored the impact of social media advertisements with quarantine on the spread of COVID-19 pandemic in the presence of asymptomatic, symptomatic and aware individuals. Their research findings emphasized continuous awareness (through social media and internet platforms) and quarantine of asymptomatic individuals as better strategies for reducing COVID-19 burdens in India.
Recently, Akinwande et al. [2] modelled the impacts of media campaign and double dose vaccination in controlling COVID-19 in Nigeria. In their work, a deterministic model with an optimal control problem for assessing the community level impact of media campaign and double dose vaccination on the transmission and control of COVID-19 was studied. Qualitative analysis of the model shows that, the dynamics of the model was completely determined by the reproduction number (Rmv). Further, the model was shown to undergo the phenomenon of forward bifurcation in the absence of double dose vaccination effects. Numerical simulation of the model using data relevant to the transmission dynamics of the disease in Nigeria, show that certain values of the basic reproduction number (R0 ≥ 7) may not prevent the spread of the pandemic even if 100 percent media compliance is achieved. In all the aforementioned works, non-incorporated non- linear recovery rates in their work. As stated in Khan et al. [7], the nonlinear recovery rate can display rich dynamics such as saddle-node, backward, Hopf, and Bogdanov-Takens bifurcations (BT).
The goal of this paper is to propose a mathematical model for the dynamics of COVID-19 pandemic incorporating isolation and non-linear recovery rate. This model is an extension of the model by Samui et al. [12], by introducing isolation and nonlinear recovery rate. The model is based on the following assumptions:
- The present study incorporates the class of isolated individuals. This assumption is in line with the information obtained from [5].
- This study incorporates the use of nonlinear recovery rate as used in the work of [7].
- This study adopts the use of standard incidence function since it is more appropriate for large population [2].
- This study assumes that the reported symptomatic infectious individuals will no longer contribute to the infection as they are isolated and moved to the Intensive Care Unit (ICU) for treatment [12]. Consequently, the rate at which individuals undergoing treatment will transmit the disease is negligible
The rest of the paper is organized as follows. The model is developed in Section 2 and analyzed in Section 3. Sensitivity analysis and numerical simulations of the model are presented in Sections 4 and 5, respectively while the concluding remarks in Section 6.
Model Formulation
The total population at time t, denoted by N (t), is divided into the mutually exclusive compartments of the susceptible individuals (S(t)), asymptomatic individuals (A(t)), reported symptomatic infectious individual (I(t)), unreported symptomatic infectious individuals (U (t)), hospitalized individuals (H(t)) and recovered individuals (R(t)).
Infectious interactions in the population are modelled using a standard incidence function and nonlinear recovery rate.
Let Λ represent the recruitment rate of individuals (assumed susceptible) into the population while β is the COVID-19 transmission rate. The terms ρθ and (1 ρ)θ represents the proportion of individuals progressing from class A to I and U , respectively. The parameter η1 accounts for the reduced rate of transmission of COVID-19 associated with the asymptomatic individuals while η2 accounts for the rapid rate of transmission of COVID-19 associated with the unreported symptomatic infectious individuals.
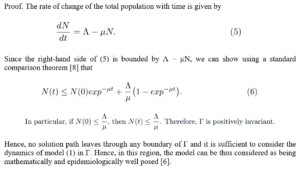
Further, individuals who are identified to have COVID-19 in the U class will progress to the I at a rate σ and subsequently moved to the isolation center for treatment at a rate τ . Individuals in the H class who are successfully treated recover at a rate κ. Furthermore, natural death rate occurs in all the classes at a rate µ, while individuals in I and H classes suffer an additional COVID-19 induced death rate δ. Putting together these definitions and assumptions, it follows that the model for the transmission dynamics of COVID-19 in the population is given by the following system of non-linear ordinary differential equations (a flow diagram of the model is shown in Figure 1, and the state variables and parameters of the model are presented in Table 1):
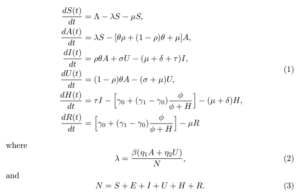
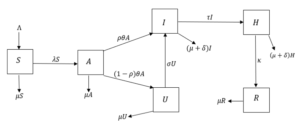
Figure 1: Schematic diagram for model (1)
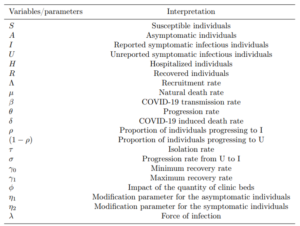
Table 1: Description of state variables/parameters in the COVID-19 model (1). 
Mathematical Analysis
Asymptotic Stability of Disease-free Equilibrium (DFE)
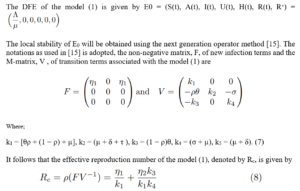
where ρ(FV−1) is the spectral radius of the matrix (FV−1).
The result below follows from Theorem 2 in [15].
Lemma 3.1. The DFE (E0) of the model (1) is locally asymptotically stable if Rc < 1 and unstable if Rc > 1.
The threshold quantity, Rc is the effective reproduction number of COVID-19 [15]. By definition, it represents the average number of secondary COVID-19 infections generated by a typical infected person in a completely susceptible population [15]. The implication of Lemma 3.1 epidemiologically is that when Rc < 1 is less than one, COVID-19 can be eliminated from the population if the initial sizes of the subpopulation of the model are in the basin of attraction
of the DFE (E0). Hence, a small inflow of COVID-19 infected persons into the community will not generate large COVID-19 outbreaks, and the disease will die out time.
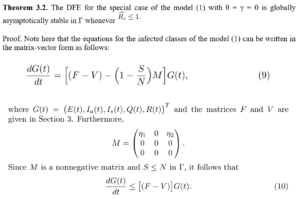
Using the fact that the eigenvalues of the matrix F −V all have negative real parts (that is, ρ(FV−1) < 1 if Rc < 1.), it follows that the linearized differential inequality system (10) is stable whenever Rc < 1. Thus, by comparison Theorem [8],

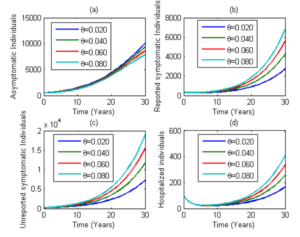
Figure 2: Simulation of model (1) showing the number of infected individuals in the asymptomatic, reported symptomatic, unreported symptomatic and hospitalized individuals. Here, the progression rate (θ) from the asymptomatic to classes I and U is varied from 0.020 to 0.080. Parameter values used are as in Table 2.
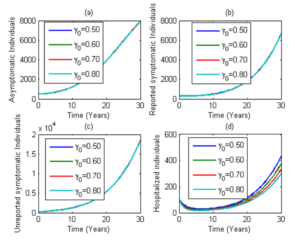
Figure 3: Simulation of model (1) showing the number of infected individuals in the asymptomatic, reported symptomatic, unreported symptomatic and hospitalized individuals. Here, the minimum recovery rate (γ0) is varied from 0.50 to 0.80. Parameter values used are as in Table 2.
Sensitivity Analysis
In this section, we conduct sensitivity analysis on the parameters of the model connected with the reproduction number, Rc using the parameter values in Table 2. The essence of this analysis is to determine the relative importance of each parameter in the model that depicts COVID-19 transmission. A method similar to the ones outlined in the works of [3,4,11] were utilized to obtain the sensitivity index of all the parameters connected to the reproduction number using the formula in (13).

where ξ denotes model parameters contained in Rc. We obtained from (13) the sensitivity indices of the parameters associated with the reproduction number as presented in Table 3. The parameters with positive sensitivity indices signify a high impact burden of COVID-19 in the population if their values keep increasing. Further, parameters in which their sensitivity indices are negative have a great effect in reducing COVID-19 burden in the population as their values increase while the others remain constant. Hence, as their values increase, the reproduction number decreases thus reducing the endemicity of COVID-19 in the population.
From the results of the sensitivity analysis presented in Table 3, some of the key parameters with high positive and negative indices are the COVID-19 transmission rate (β) and the proportion of individuals progressing to the class of reported symptomatic infectious individuals (ρ), respectively. These are the top parameters that significantly drive the dynamics of COVID-19 in the population. Consequently, to control the spread of the disease in the population, COVID-19 transmission rate (β) must be sufficiently reduced. This implies that
as soon as individuals are suspected of having COVID-19 symptoms, they should be quickly isolated for possible treatment if the disease must be curtailed in the population.
Numerical Simulations
In this section, numerical simulations are carried out on model (1) using the parameter values in Table 2. The model (1) is solved numerically using MATLAB ODE45 solver. Figure 4 shows the effect of the progression rate from the asymptomatic class to the reported symptomatic infectious and unreported symptomatic infectious classes. An increase in the progression rate (θ) leads to an increase in the number of asymptomatic, reported symptomatic, unreported symptomatic and hospitalized individuals.
In Figure 3, we observe that, increasing the minimum recovery rate of COVID-19 infected patients leads to an initial decrease in the number of hospitalized patients before subsequent increase. The reason for this could be attributed to the number of unreported symptomatic infectious individuals who are progressing to reported symptomatic infectious class for immediate isolation. It is therefore not surprising that, this parameter had no significant effect on the number of infected individuals in the asymptomatic, reported symptomatic and unreported symptomatic stages of infection. Consequently, concerted effort must be put in place by health experts to identify all unreported cases of COVID-19 for prompt isolation.
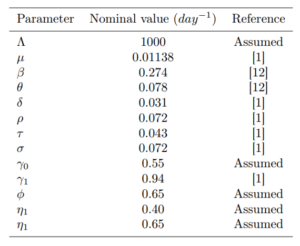
Table 2: The parameter values of model (1)
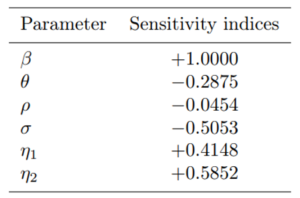
Table 3: Sensitivity indices of some parameters values
Conclusion
This paper presents a population model for COVID-19 pandemic incorporating isolation and nonlinear recovery rate. The disease-free equilibrium (DFE) of the model (1) is locally asymptotically stable whenever the associated reproduction number is less than unity. The disease-free equilibrium of the model (1) is shown to be globally asymptotically stable whenever the associated reproduction number is less than unity. Results from the sensitivity analysis of the model, using the reproduction number, Rc show that the top parameters that largely drive the dynamics of COVID-19 in the population are COVID-19 transmission rate and the proportion of individuals progressing to the class of reported symptomatic infectious individuals. Numerical simulations of the model suggest increasing the minimum recovery rate of COVID-19 infected patients in the population leads to an initial decrease in the number of hospitalized patients before subsequent increase. The reason for this could be attributed to the number of unreported symptomatic infectious individuals who are progressing to reported symptomatic infectious stage of infection for immediate isolation.
The study is preliminary and can be extended in the following ways:
- By establishing the type of bifurcation model (1) can undergo.
- Theoretical results such as the global asymptotic stability of the unique
- endemic equilibrium can be obtained
Disclosure
Acknowledgements: The authors sincerely appreciate their various institutions for providing a conductive research environment.
Funding: This work did not enjoy funding from any institution or agency.
Competing interests: The authors declare that they have no financial or competing interests
References
- Akinwande NI, Ashezua TT, Gweryina RI (2022) Mathematical model of covid-19 transmission dynamics incorporating booster vaccine program and environmental contamination. Heliyon 8(11): e11513.
- Akinwande NI, Somma SA, Olayiwola RO, Ashezua TT, Gweryina RI, et al. (2023) Modelling the impacts of media campaign and double dose vaccination in controlling COVID-19 in Nigeria. Alexandria Engineering Journal 80: 167–190.
- Annas S, Pratama MI, Rifandi M, Sanusi W, Side S (2020) Stability Analysis and Numerical Simulation of SEIR Model for pandemic COVID-19 Spread in Indonesia. Chaos, Solitons and Fractals 139(110072).
- Ashezua TT, Gweryina RI, Kaduna FS (2023) Population dynamics of a mathematical model for monkeypox. International Journal of Mathematical Analysis and Modelling 6: 40–63.
- Cleveland Clinic. Coronavirus, covid-19. retrieved on May 20, 2024.
- Hethcote HW (2000) The mathematics of infectious diseases. SIAM Rev 42(4): 599–653.
- Khan IU, Qasim M, Koufi AM, Ullah H (2022) The stability analysis and transmission dynamics of the sir model with nonlinear recovery and incidence rates. Hindawi Mathematical Problems in Engineering.
- Lakshmikantham S, Leela S, Martynyuk AA (1989) Stability Analysis of Nonlinear Systems, Marcel Dekker, New York.
- National Library of Medicine. Covid-19. retrieved on May 20, 2023.
- Rai RK, Khajanchi S, Tiwari PK, Venturino E, Misra AK (2020) Impact of social media advertisements on the transmission dynamics of covid-19 pandemic in india. Appl. Math. Comput 68: 19–44.
- Rangkuti YM, Firmansyah, Landong A (2022) Sensitivity analysis of seir epidemic model of covid-19 spread in Indonesia. Journal of Physics: Conference Series,
- Samui P, Mondal J, Khajanchi S (2020) A mathematical model for covid-19 transmission dynamics with a case study of India. Chaos, Solitons and Fractals 140: 110173.
- Tang B, Wang X, Li Q, Bragazzi NL, Tang S, Xiao Y, et al. (2020). Estimation of the transmission risk of the 2019-ncov and its implication for public health interventions. Chin. Med 9(2): 462.
- Turkyilmazoglu M (2022) An extended epidemic model with vaccination: weak immune. Physics A, 598: 127429.
- van den Driessche P, Watmough J (2002) Reproduction numbers and subthreshold endemic equilibria for compartmental models of disease transmission. Mathematical Biosciences 180: 29–48.


