

The Application of Chitosan/nTiO2Nanocomposite in the Elimination of Cu(II) from Aqueous Media: Fixed-Bed Column Adsorption Study and Modelling Samanwita Bhattacharya1, Nirjhar Bar 1,2, Baisali Rajbansi1, Sudip Kumar Das1*
1Department of Chemical Engineering, University of Calcutta, A. P. C. Road, Kolkata, India
2St. James’ School, A. J. C. Bose Road, Kolkata, India
*Correspondence to: Sudip Kumar Das
Citation: Bhattacharya S, Bar N, Rajbansi B, Das SK (2023) The Application of Chitosan/nTiO2Nanocomposite in the Elimination of Cu(II) from Aqueous Media: Fixed-Bed Column Adsorption Study and Modelling. Sci Academique 4(2): 99-115
Received: 27 September, 2023; Accepted: 24 October, 2023; Publication: 30 October, 2023
Abstract
The current investigation employed Chitosan/nTiO2 nanocomposite (CTNC) adsorbent to sequester Cu(II) ions from the aqueous medium by column adsorption. The experimentations were executed at optimum pH 6.5 under variable operating conditions, viz. bed depths (3-7 cm), flow rates (10-30 ml min-1) and Cu(II) concentration (10-30 mg L-1). Seven kinetic models checked experimental records. Thomas model was established to be the best-fit model correlated to a bed height of 5 cm, inner diameter of column 1.5 cm, the influent flow rate of 10 mlmin-1, and the initial Cu(II) concentration of 30 mg L-1. The potential application of multiple linear regression (MLR) and genetic algorithm (GA) techniques to forecast the elimination of Cu(II) are also verified.
Keywords: Chitosan; Nanocomposite; Scale-up; Thomas model; Genetic algorithm
Introduction
Water is a fundamental component of life’s presence on the earth. However, nearly all water bodies have become polluted due to ever-increasing population, disorganized urbanization, technological development and voluminous waste production from various anthropogenic sources. It is miserable that 70– 80% of the problems in developing countries are related to water pollution [1]. A predominantly severe pollution problem is the contamination of waters by heavy metals due to their portability and toxicity in natural hydrological ecosystems. The presence of contaminants like Cu(II) at a higher concentration than the tolerance level can give rise to severe, devastating effects on human physiology and other biological systems. Hence, the proper treatment of wastewater is an issue of utmost priority. Researchers from various fields of science and technology have endeavoured to establish several decontamination processes. However, adsorption is an extensively used technology for sequestration of inorganic and organic pollutants. According to the environmental apprehension, great attention is centred on several works involving chitosan-metal oxide nano-bio composites using a wide range of nano-sized metal-oxides (nMOs) to purify the contaminated water by heavy metals. During the last few decades, the computer processing power has dramatically improved. Therefore, the application of AI has also increased in the same way as depicted by the literature [2,3]. Genetic algorithms and statistical modelling have also become more popular [4]. It is worth venturing into the possibilities of testing the applicability of GA and MLR for the prediction of percentage removal. This study focuses on the effects of various operating parameters of Cu(II) adsorption by chitosan/nanoTiO2 nanocomposites (CTNC) in a fixed bed column. The applicability of various kinetic models is studied to explain the breakthrough curve. The application of statistical and genetic algorithm modelling on the data collected from the experiment has also been successfully applied to calculate the percentage removal of Cu(II)
Experimental Materials
Analytical laboratory grade reagents, namely chitosan powder, acetic acid, 25% glutaraldehyde solution, nano titanium(IV) oxide powder ethanol, copper sulphate pentahydrate (CuSO4, 5H2O), NaOH pellets, hydrochloric acid from E. Merck India Limited and doubly distilled water were employed throughout all the experiments.
Methods Preparation of adsorbent (chitosan/nTiO2 nanocomposite)
Based on our earlier study, Chitosan/nTiO2 nanocomposite (CTNC) adsorbents were prepared with different chitosan:nTiO2 (W/W) ratios. Amongst those, chitosan:nTiO2 (W/W)= 1:1 (CTNC1-1) was most promising for Cu(II) elimination in batch mode [5]. Hence, the adsorbent CTNC1-1 is chosen for the fixed-bed column method.
Characterization
SEM analysis, FTIR studies, BET analysis, XRD studies, TGA, and calculation of the point of zero charges (pHPZC) were done previously [4].
Adsorbate solution preparation
The synthetic Cu(II) stock solution dissolved 3.929 g of copper sulphate pentahydrate in 1 L water. The stock solution was diluted to form the desired concentrated solution.
Column adsorption experimentation
Cu(II) adsorption from aqueous media was done within a fixed bed column at an initial metal concentration ranging from 10-30 mg L-1, bed height ranging from 3-7 cm and flow rate ranging from 10-30 ml min-1 using three glass columns 33 cm long and with an inner diameter of 1.5 cm. A stainless-steel sieve plate was provided as base support, and a little glass wool was placed over it. The columns were packed with the requisite amount of adsorbent. The influent Cu(II) solution was allowed to pass through the columns using a peristaltic pump (Model 7535-04, Cole-Parmer, USA) in down-flow mode at optimum pH 6.5 [5] and room temperature. The resultant Cu(II) solution was quantified using AAS (AA 240 VARIAN, Australia Varian Spectra AA 55, USA) by the standard procedure [6] at set intervals. The percentage removal efficiency was calculated using Eqs. (1-3) [7,8].
MLR analysis
For the equation related to multiple linear regression, all the independent variables as chosen for this study are bed height (Z), column diameter (Dc), flow rate (Q), time (t), influent concentration (Co) and residual concentration (Ct), and the dependent variable was removal percentage of Cu(II), i.e., ![]()
Genetic algorithm
The applicability of GA depends on the processing time associated with the training. The training process in GA is associated with computerized programming that involves several values (inputs and outputs) relating to some data collected from the experimentation concerned with a problem. Training time is reduced with the fast-processing power of a microprocessor, RAM, etc.
The data used in the case of MLR has been replicated three times with successive rows and columns to have 3 samples viz. Cu(II)-R1, Cu(II)-R2 and Cu(II)-R3. The inputs are the MLR analysis parameters and are presented in Table 3. In the next step, randomization for the 3 sets is carried out (independent of each other) to omit all types of random error that can arise during the training. This step is essential for generalization. Then, the portion of the data used for final prediction (i.e., 10% of the overall data about each set) was segregated and kept aside for these 3 samples, respectively. Following the same process, cross-validation (i.e., 20% of the data about each set) is segregated and kept separate for these 3 samples. Finally, 70% of the overall data about each set is kept for training. The optimization of inputs is performed using a well-known training algorithm (Levenberg-Marquardt), as evidenced by the literature survey [4,5].
Results and Discussion
Characterization of adsorbents
The details of SEM analysis, FTIR studies and BET analysis, XRD studies, TGA, point of zero charge (pHPZC) were described in our earlier work [5].
Effects of process parameters
Influence of bed depth
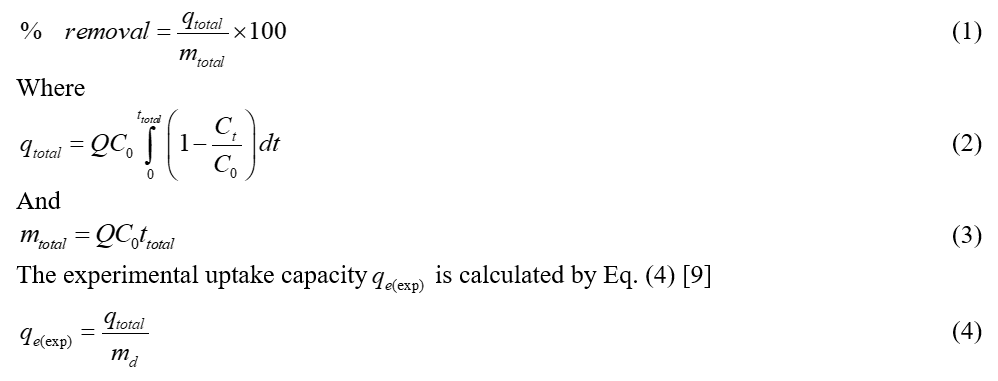
The adsorption experiments were carried out at various bed heights, 3 cm, 5 cm and 7 cm, (Figure 1) with constant metal ion concentration, 10 mg L-1 and constant flow rate, 10 ml min-1. Breakthrough and exhaustion time were raised with bed height, signifying improved Cu(II ) removal due to greater accessibility of adsorptive sites and higher bed residence time at greater bed depth [8].
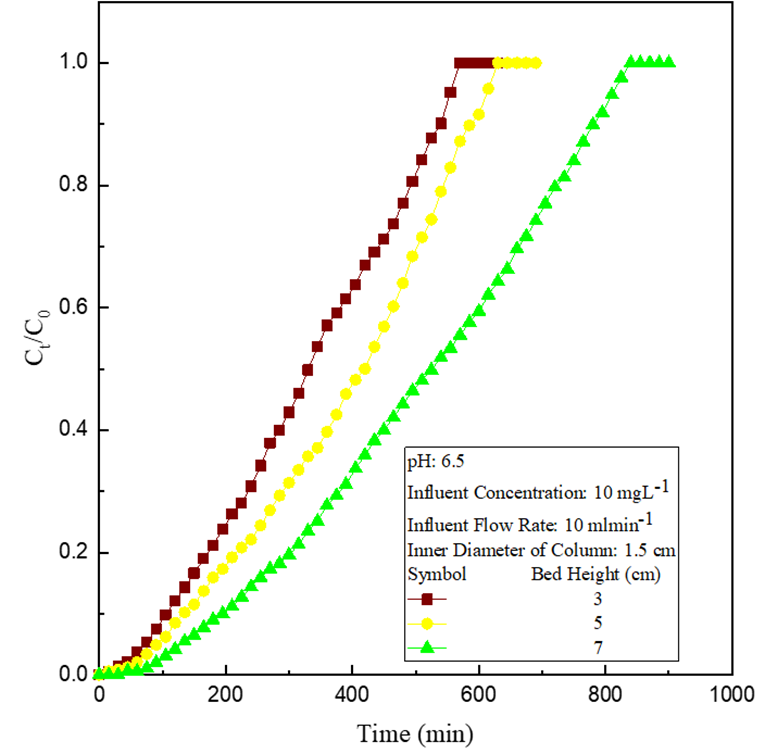
Figure 1: Effect of variation of bed depth.
Impact of influent flow rate
The adsorption experiments were carried out at various influent flow rates, 10-30 ml min-1, (Figure 2) at fixed bed height, 3 cm and influent Cu(II) concentration,10 mg L-1. Breakthrough and exhaustion time reduced with flow rate, signifying less Cu(II) removal due to less contact time and reduced film diffusion resistivity of the adsorbate on the adsorbent at increased flow rates [7].
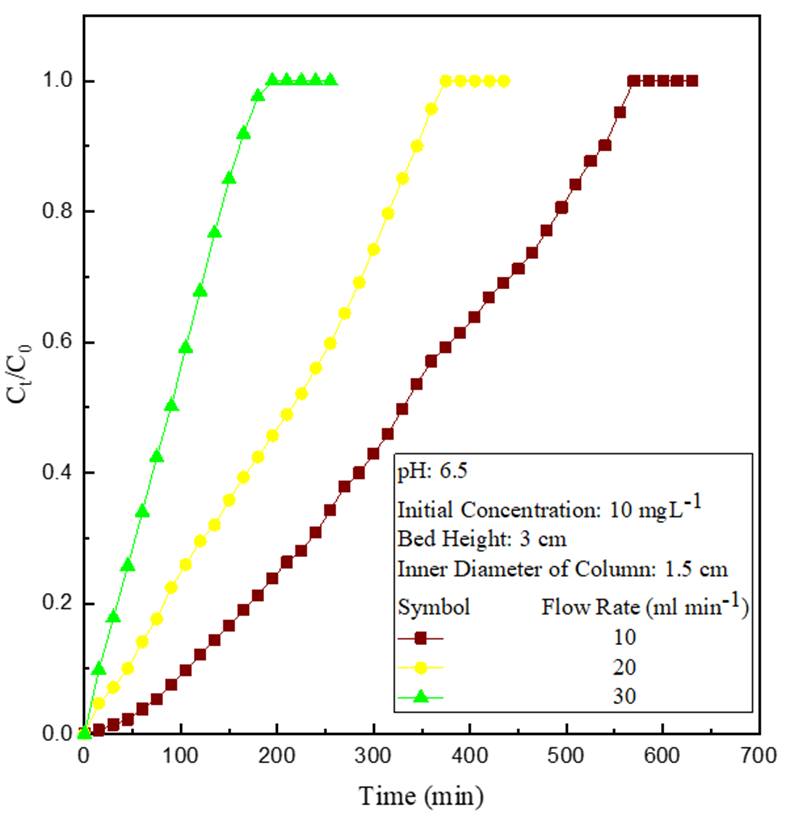
Figure 2: Effect of variation of influent flow rate.
Influence of influent metal concentration
The experimental observations were recorded at various influent dye concentrations (10-30 mg L-1) (Figure 3) at constant bed height (5 cm) and constant flow rate (10 ml min-1). Breakthrough time, as well as exhaustion time, are reduced with Cu(II) concentration, signifying less Cu(II) removal due to a faster rate of diffusional mass transfer and faster saturation rate of binding centres at higher Cu(II) concentration [7,8].
Figure 3: Effect of variation of initial Cu(II) concentration.
Kinetic Study
Seven kinetic models were employed to evaluate the experimental records. The calculated values of kinetic parameters with correlation coefficients values, the kinetic equations and their interpretations are detailed in Table 1. Higher R2 value (i.e., close to 1) indicates the excellent agreement of calculated adsorption capacities obtained from the model equation with experimental data. Hence, from Table, the adsorption process might be best explained by the Thomas model, which was employed for scale-up design.
|
Initial Cu(II) concentration, C0 mg L-1 |
10 |
10 |
10 |
20 |
30 |
10 |
10 |
||||||
|
Influent flow rate, Q ml min-1 |
10 |
10 |
10 |
10 |
10 |
20 |
30 |
||||||
|
Bed height, Z cm |
3 |
5 |
7 |
5 |
5 |
3 |
3 |
||||||
|
Experimental Adsorption capacity, mg g-1 |
8.266 |
6.653 |
6.811 |
9.224 |
11.093 |
10.2 |
6.718 |
||||||
|
Bohart-Adams model (Bohart & Adams, 1920) [10] |
|||||||||||||
|
Mathematical equation |
Comments |
||||||||||||
|
Based on the surface reaction theory, this model assumes that the equilibrium is not attended in a continuous adsorption process, and the adsorption rate is proportional to the adsorption capacity. The rate constant decreased with bed height and influent concentration but increased with flow rate. The adsorption capacity of the bed decreased with bed depth but increased with influent concentration. |
|||||||||||||
|
Lmg-1min-1 |
0.00068 |
0.00066 |
0.00050 |
0.00041 |
0.00026 |
0.00071 |
0.00116 |
||||||
|
gL-1 |
6.326 |
6.127 |
5.80 |
8.960 |
11.461 |
8.752 |
6.592 |
||||||
|
R2 |
0.81152 |
0.84359 |
0.82767 |
0.82749 |
0.91295 |
0.89462 |
0.89375 |
||||||
|
Thomas model (Thomas, 1944) [11] |
|||||||||||||
|
Mathematical equation |
Comments |
||||||||||||
|
This model assumes the Langmuir kinetics for adsorption–desorption and the rate of the driving force is the second-order reversible reaction kinetics with no axial dispersion in the column. The rate constant decreased with bed depth and influent concentration but increased with flow rate. Maximum adsorption capacity increased with influent concentration. |
|||||||||||||
|
mlmg-1min-1 |
1.107 |
1.048 |
0.816 |
0.6975 |
0.458 |
1.38 |
3.103 |
||||||
|
mgg-1 |
8.505 |
6.747 |
6.898 |
9.358 |
11.261 |
10.220 |
6.482 |
||||||
|
R2 |
0.9474 |
0.9521 |
0.9477 |
0.9534 |
0.9745 |
0.9588 |
0.9668 |
||||||
|
Wolborska model (Wolborska, 1989) [12] |
|||||||||||||
|
Mathematical equation |
Comments |
||||||||||||
|
This model describes the concentration distribution in the fixed bed at the low concentration region of the breakthrough curve. The kinetic coefficient values increased with an increase in flow rate but decreased with influent concentration and bed depth. The adsorption capacity of the bed increased with influent concentration but decreased with bed depth. |
|||||||||||||
|
βW min-1 |
4.283 |
4.056 |
2.888 |
3.665 |
2.930 |
6.205 |
7.674 |
||||||
|
gL-1 |
6.326 |
6.127 |
5.780 |
8.960 |
11.461 |
8.752 |
6.592 |
||||||
|
R2 |
0.8115 |
0.8436 |
0.8277 |
0.8275 |
0.9130 |
0.8946 |
0.8938 |
||||||
|
Yoon-Nelson model (Yoon & Nelson, 1984) [13] |
|||||||||||||
|
Mathematical equation |
Comments |
||||||||||||
|
This model assumes that the probability rate of adsorption decreases for each adsorbate is proportional to the probability of its adsorption and breakthrough on the adsorbent surface. The half-life of adsorbate () decreased with flow rate and influent concentration but increased with bed height. The rate constant increased with flow rate but decreased with bed depth. |
|||||||||||||
|
min-1 |
0.01107 |
0.01048 |
0.00816 |
0.01395 |
0.01374 |
0.0138 |
0.03103 |
||||||
|
min |
337.305 |
391.204 |
514.158 |
271.299 |
217.633 |
217.633 |
85.6980 |
||||||
|
R2 |
0.9474 |
0.9521 |
0.9477 |
0.9534 |
0.9745 |
0.9588 |
0.9668 |
||||||
|
Yan et al. model (Yan et al., 2001) [14] |
|||||||||||||
|
Mathematical equation |
Comments |
||||||||||||
|
It is an empirical equation to overcome the drawback of the Thomas model, especially for the prediction of effluent concentration nearly at the time zero. The rate constant increased with increasing bed depth and flow rate but decreased with influent concentration. Maximum adsorption capacity increased with increasing flow rate and influent concentration but decreased with bed depth. |
|||||||||||||
|
mlmg-1min-1 |
2.064 |
2.099 |
2.566 |
1.061 |
0.553 |
3.323 |
6.182 |
||||||
|
mgg-1 |
0.0420 |
0.0232 |
0.0115 |
0.0697 |
0.1651 |
0.1821 |
0.5526 |
||||||
|
R2 |
0.9393 |
0.9062 |
0.9321 |
0.9153 |
0.8729 |
0.8514 |
0.8328 |
||||||
|
Modified dose-response model (Yan et al., 2001) [14] |
|||||||||||||
|
Mathematical equation |
Comments |
||||||||||||
|
It is an empirical model developed to minimize the error presented by the Thomas model at the lower and higher portion of the breakthrough curve. Maximum adsorption capacity increased with influent concentration. The model parameter increased with bed depth. |
|||||||||||||
|
2.064 |
2.099 |
2.566 |
2.122 |
1.660 |
1.662 |
2.061 |
|||||||
|
mgg-1 |
7333.50 |
6104.88 |
6117.84 |
8046.42 |
9768.73 |
8406.53 |
5024.14 |
||||||
|
R2 |
0.9393 |
0.9062 |
0.9321 |
0.9153 |
0.8729 |
0.8514 |
0.8328 |
||||||
|
Bed depth service time model (Chen et al., 2013) [15] |
|||||||||||||
|
Mathematical equation |
Comments |
||||||||||||
|
This model is used to predict the bed capacity using different breakthrough values. The BDST model parameters can help scale up the process for other flow rates without further experimental runs. The graph of t vs. Z does not pass through the origin, indicating that the adsorption process is complex and involves more than one rate-limiting step. The values of and increased with increasing values. |
|||||||||||||
|
gL-1 |
L mg−1 min−1 |
R2 |
|||||||||||
|
0.1 |
1.2592 |
-0.00659 |
0.9505 |
||||||||||
|
0.5 |
2.7621 |
0 |
0.9975 |
||||||||||
|
0.9 |
3.4143 |
0.000658 |
0.8937 |
||||||||||
Table 1: Kinetic models of column study.
Scale-up design
The consideration of scale-up designing was important for lab-to-land implementation. Based on the best-fitted kinetic model, a scale-up design was developed for the fixed-bed column study. Thomas model was established to be the best-fit model corresponding to 5 cm bed height, 10 ml min-1influent flow rate, and the influent Cu(II) concentration 30 mgL-1.
|
W m3 |
min |
Cw mg L-1 |
Qd L min-1 |
D m |
Mad kg/day |
Hc m |
H m |
|
10 |
480 |
30 |
20.83 |
0.68 |
3.22 |
0.4 |
0.401 |
|
20 |
600 |
30 |
33.33 |
0.87 |
5.15 |
0.5 |
0.501 |
Table 2: Scale-up designfor adsorption of Cu(II) by CTNC1-1 in fixed bed column.
Eqs. (5-8) [7,8] were involved in estimating parameters presented in Table 2 for scale-up design in the column adsorption mode.
Regeneration study
According to the previous desorption study [5], the regenerated adsorbent was re-utilized in the column. The regeneration efficiency was found to be 76.38 % from Eqs. (9-10).
MLR study
The data accumulated from the experiment to predict PRcol-TiO₂-Cu(Ⅱ) using MLR is stated in Table 3.
|
Parameter |
Range |
|
Bed height, Z (m) |
0.03-0.07 |
|
Column diameter, Dc(m) |
0.015 |
|
Flow rate, Q (ml/min) |
10-30 |
|
Time, t (min) |
0-840 |
|
Influent Conc., CO (mg/L) |
10-30 |
|
Residual Conc., Ct (mg/L) |
0-30 |
|
Percentage removal, (%) |
0-100 |
Table 3: Description of data for MPR.
The data from Table 3 yielded the following first-degree polynomial equation for measuring the removal efficiency of Cu(II) by CTNC1-1.
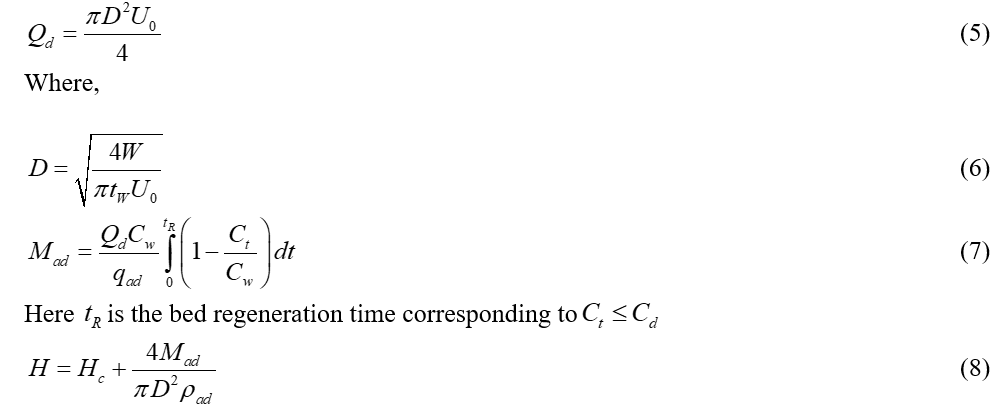
The variance, mean squared error and correlation coefficient achieved from Eq. (11) are 0.056125, 0.00315 and 0.9742 respectively. In this case, the t-value is 1.9703 (231 degree of freedom, within the 95% confidence range). Figure 4 depicts the comparison plot using MLR.
Figure 4: MLR comparison plot.
Data analysis with Genetic algorithm
The processes of training, as well as the cross-validation, are simultaneous. However, it was not allowed for perpetuity, but a limitation of 500 epochs is set for the overall process. At most, 100 iterations are allotted to improve MSE (mean squared error) associated with cross-validation. During the iterative process, training is halted if no improvement is observed. The least amount of error values (cross-validation) observed during the training process is recorded, and the network with these values of weights for this iteration is considered an optimized network.
Then the GA process is observed to find the generation for which the least value of generation error is achieved. Slight modification concerning the chromosomes is done for this process while maintaining the probability value associated with a mutation at 0.1. The crossover probability value is kept at 0.9. Ananalogous type of processing had been done by researchers, as evident from the literature review [16,17]. That generation was considered optimal once the generation error achieved a value around 10-6–10-7. Table 4 depicts the generation errors and the subsequent results related to the GA analysis. Thus, the observations of Table 4 and Figure 5 establish that the R-value of unity is achieved for these samples. The observations validate the efficient forecast of the percentage removal of the adsorbate.
|
Randomization No. |
Minimum Generation error |
AARE |
SD (σ) |
MSE |
CCC (R) |
|
Cu(II)R1 |
4.0447×10⁻⁸ |
0.00029 |
0.0004 |
0.00024 |
1 |
|
Cu(II)R2 |
1.0103×10⁻⁷ |
0.00028 |
0.00025 |
0.00038 |
1 |
|
Cu(II)R3 |
3.9035×10⁻⁷ |
0.00169 |
0.00389 |
0.00132 |
1 |
Table 4: Performance of the optimized network using GA.
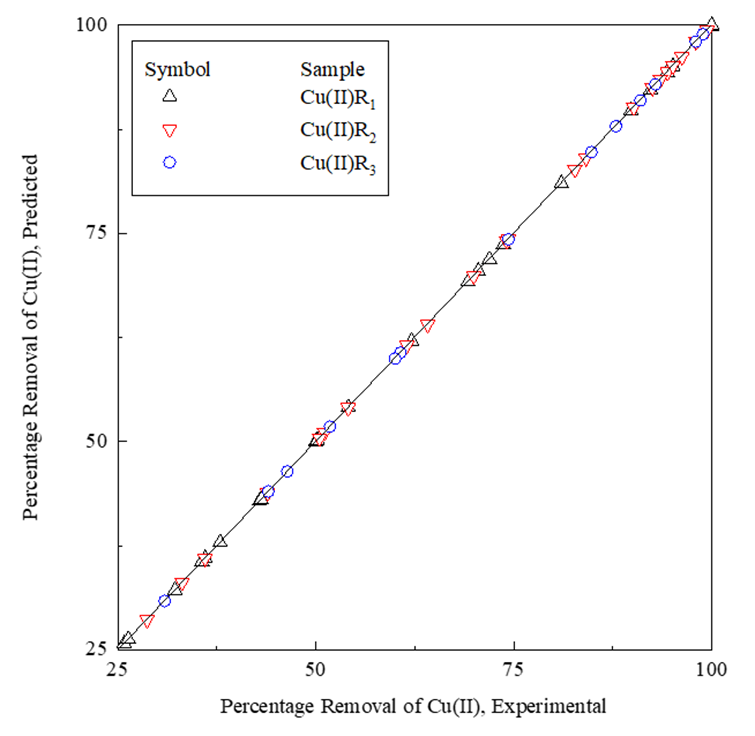
Figure 5: GA comparison plot.
Conclusion
The potency of CTNC1-1 for eliminating Cu(II) from aqueous mediaby fixed-bed column technique at different operating situations was evident from this work. The outcomes might be abbreviated like this:
- The bed depth of CTNC1-1 influenced the removal of Cu(II) within the column, influent flow rate and metal ion concentration.
- The removal was raised with bed depth and reduced with influent flow rate and Cu(II) concentration.
- The Thomas model brilliantly described the kinetic process with a good correlation.
- The usefulness of the CTNC1-1 adsorbent can be recommended from the scale-up design of the adsorption column.
- The MLR, and GA, also predicted the percentage removal with acceptable statistical accuracy.
Nomenclature
amdr Modified dose-response kinetic model parameter
C0 Influent Cu(II) concentration (mg L−1)
Cd Cu(II)discharge limit for inland surface water (mg L-1)
Ct Effluent Cu(II) concentration at time t (mg L−1)
Cw Cu(II) concentration in wastewater (mgL-1)
D Diameter of the adsorption column (m)
H Total bed height in the column (m)
Hc Additional height for accessories (m)
KBA Kinetic constant in Bohart-Adams model (L mg−1 min−1)
Kbdst Kinetic constant in Bed depth service time model (L mg−1 min−1)
KYN Kinetic constant in Yoon-Nelson kinetic model (L mg−1 min−1)
KTh Kinetic constant in Thomas model (ml mg−1 min−1)
KY Kinetic constant in Yan et al. model (ml mg−1 min−1)
Mad Designed adsorbent quantity (kg)
md Mass of dry adsorbent in column (g)
mtotal Mass of the adsorbate added to the column (g)
NOBA Bohart-Adams model adsorption capacity of bed (mg L−1)
Now Wolborska model adsorption capacity of bed (mg L−1)
Nobdst Bed depth service time model adsorption capacity (gL-1)
Q Volumetric flow rate (ml min−1)
Qd Designed volumetric flow rate (ml min-1)
qe(exp) Experimental adsorption capacity (mg g-1)
qmdr Modified dose–response model maximum adsorption capacity (mg g−1)
qR Amount of Cu(II) adsorbed after regeneration (mg)
qTh Thomas model maximum adsorption capacity (mg g-1)
qY Yan et al. model maximum adsorption capacity (mg g−1)
qtotal Total Cu(II) adsorbed (mg)
t Time (min)
tR Bed regeneration time (min)
tRS Bed saturation time after regeneration (min)
ttotal Total flow time (min)
tw Working time (min)
U0 Superficial velocity (cm min−1)
Veff Effluent volume (L)
W Daily wastewater flow (m3)
Z Bed depth (cm)
Greek letters
βW Kinetic coefficient of external mass transfer in Wolborska model (min−1)
ε Regeneration efficiency
p ad Density of the adsorbent (kg m−3)
TYN Half-life of adsorbate (min)
References
- Vardhan KH, Kumar PS, Panda RC (2019) A review on heavy metal pollution, toxicity and remedial measures: Current trends and future perspectives. Journal of Molecular Liquids 290: 111197.
- Banerjee M, Bar N, Basu R, Das S (2017) Comparative study of adsorptive removal of Cr(VI) ion from aqueous solution in fixed bed column by peanut shell and almond shell using empirical models and ANN. Environmental Science and Pollution Research: 24.
- Das B, Ganguly UP, Bar N, Das SK (2015) Holdup prediction in inverse fluidization using non-Newtonian pseudoplastic liquids: Empirical correlation and ANN modeling. Powder Technology 273: 83–90.
- Bhattacharya S, Bar N, Rajbansi B, Das SK (2021) Adsorptive Elimination of Cu(II) from Aqueous Solution by Chitosan-nanoSiO2 Nanocomposite—Adsorption Study, MLR, and GA Modeling. Water, Air, & Soil Pollution 232: 161.
- Bhattacharya S, Bar N, Rajbansi B, Das SK (2023) (n.d.). Synthesis of Chitosan-nTiO2 Nanocomposite, Application in Adsorptive Removal of Cu (II)—Adsorption and Desorption study, Mechanism, Scale-up Design, Statistical and Genetic Algorithm Modeling. Applied Organometallic Chemistry 36: e7094.
- Standard Methods for Examination of Water and Wastewater, 23rd edition, APHA, AWWA, WEF, Washington, DC, New York, (2017). (n.d.).
- Banerjee M, Basu RK, Das SK (2019) Cu(II) removal using green adsorbents: Kinetic modeling and plant scale-up design. Environmental Science and Pollution Research International 26: 11542–11557.
- Mandal A, Majumder A, Banik I, Ghosh K, Bar N, et al. (2021). Fixed-bed column study for removal of phenol by neem leaves – Experiment, MLR and ANN analysis. Sustainable Chemistry and Pharmacy 23: 100514.
- López-Cervantes J, Sánchez-Machado DI, Sánchez-Duarte RG, Correa-Murrieta MA (2018) Study of a fixed-bed column in the adsorption of an azo dye from an aqueous medium using a chitosan–glutaraldehyde biosorbent. Adsorption Science & Technology 36: 215–232.
- Bohart GS, Adams EQ (1920) SOME ASPECTS OF THE BEHAVIOR OF CHARCOAL WITH RESPECT TO CHLORINE.1. Journal of the American Chemical Society 42: 523–544.
- Thomas HC (1944) Heterogeneous Ion Exchange in a Flowing System. Journal of the American Chemical Society 66: 1664–1666.
- Wolborska A (1989) Adsorption on activated carbon of p-nitrophenol from aqueous solution. Water Research 23: 85–91.
- Yoon YH, Nelson JH (1984). Application of gas adsorption kinetics. I. A theoretical model for respirator cartridge service life. American Industrial Hygiene Association Journal 45: 509–516.
- Yan G, Viraraghavan T, Chen M (2001) A New Model for Heavy Metal Removal in a Biosorption Column. Adsorption Science & Technology 19: 25–43.
- Chen YS, Chang WC, Chiang SM, Tseng CC, Su MH (2013) Reusing spent polyaluminum chloride sludge as adsorbent for phosphate removal from secondary wastewater effluent. Desalination and Water Treatment 51: 3344–3352.
- Ghosh K, Bar N, Roymahapatra G, Biswas AB, Das SK (2022) Adsorptive removal of toxic malachite green from its aqueous solution by Bambusa vulgaris leaves and its acid-treated form: DFT, MPR and GA modeling. Journal of Molecular Liquids 363: 119841.
- Let S, Bar N, Basu RK, Das SK (2023) Terminal settling velocity for binary irregularly shaped particle mixture from fluidization study: Experiment, empirical correlation, and GA-ANN modeling. Particulate Science and Technology 41: 84-92.